Here’s the 60th Monthly Hosting Performance Contest Roundup for January 2021!
Starting from this month I will report on four hosts and different installations. This is a different approach than the way I used to monitor the hosts for the last 5 years.
- Lite installation is good for monitoring a shared server performance as is without using any caching solutions.
- Heavy installation is great to see how a real-world website with a caching plugin performs on a particular hosting.
By the way, you can find the comparison tables and charts on the hosts’ performance for previous months here.
Let’s see how the hosts performed in this month!
Common Information
As you may already know, I’ve been monitoring the performance of some of the best hosting providers I know as well as some other well-known hosts for years.
In short, since 2013 I’ve been picking out great hosts judging by real users reviews, professional hosting community opinion, long honorable business experience and other factors which make a great hosting. In the beginning of 2020 I decreased the number of the tested hosts to focus on the most popular ones among my readers.
As before, I buy anonymously hosting accounts with different hosts in order to closely monitor their performance (basically, uptime checked every minute and full page load time checked every 30 minutes) using a professional monitoring service pingdom.com. I use the most basic and the cheapest plans of A2, GeekStorage and HawkHost which allow to host at least two websites. With Glowhost I use the plan what allows to host just one site. You can read more about my monitoring methodology here.
Please note that I recommend not all of the hosts mentioned on this page. My recommended hosts are here.
Hosting Performance Contest – Results
Here are the four hosts that you can compare this month:
- A2Hosting (I recommend it, here’s my review)
- GeekStorage (I recommend it, here’s my review)
- HawkHost (I recommend it, here’s my review)
- GlowHost (This host is not cheap at all and I use it for comparison purposes with other hosts)
The tables to compare the Hosting Performance Contest results
Lite installations (default WP installations, no plugins used except Bulletproof Security, no caching plugins):
Heavy installations (WP installation with lots of plugins; the tested page is built with Elementor and full of content; the security plugin is Bulletproof Security; caching plugin is a free W3 Total Cache with automatic settings):
Table column notes:
Place: The place a hosting has won in this Contest (the less the better).
Load Time: Average Full Page Load Time (the less the better). Checked every 30 minutes.
Uptime: Uptime (the more the better). Checked every minute. The value is rounded so that there are two figures left after the period.
Downtime: Time during the tested period when the tested website on a particular host was not responsive for more than 10 seconds (the less the better). Checked every minute.
Color areas: Green is superb and above the highest standards. The greener, the better. Yellow is good, but below the highest standards. Orange is so-so; worse than yellow. Red is comparatively bad.
The table with hosting prices
1 year: Regular prices (after the first invoice) for 1-year plan.
2 years: Regular prices (after the first invoice) for 2-year plan.
3 years: Regular prices (after the first invoice) for 3-year plan.
Min Price: The minimum price officially available for the first invoice (can be for 1-year, 2-year or 3-year plan).
Limited-time offers with more discounts are not included in these prices. Check out if there are special offers currently available by visiting the hosting websites.
Worthy: This column indicates my recommended hosts.
The charts with the Hosting Performance Contest results
Hosting speed tested on Lite installations:
Hosting speed tested onHeavy installations:
Uptime tested on Lite installations:
Uptime tested on Heavy installations:
The red vertical line indicates the 99.9% uptime which is considered to be top-notch for shared hosting.
Hosting Performance Contest Results – Source data
I use pingdom.com services for hosting uptime and full page load (speed) monitoring. The uptime is performed from two locations in order to decrease chances of false alerts and make monitoring results more objective. Speed is tested from US location.
For the ease of reporting I use weekly data, not monthly. In other words, I take 4 or 5 weeks that make up the current month, and report using this data. Next month I will report from the next week. No weeks will be missing. Each week will be counted only once.
You can read more about my methodology of monitoring here.
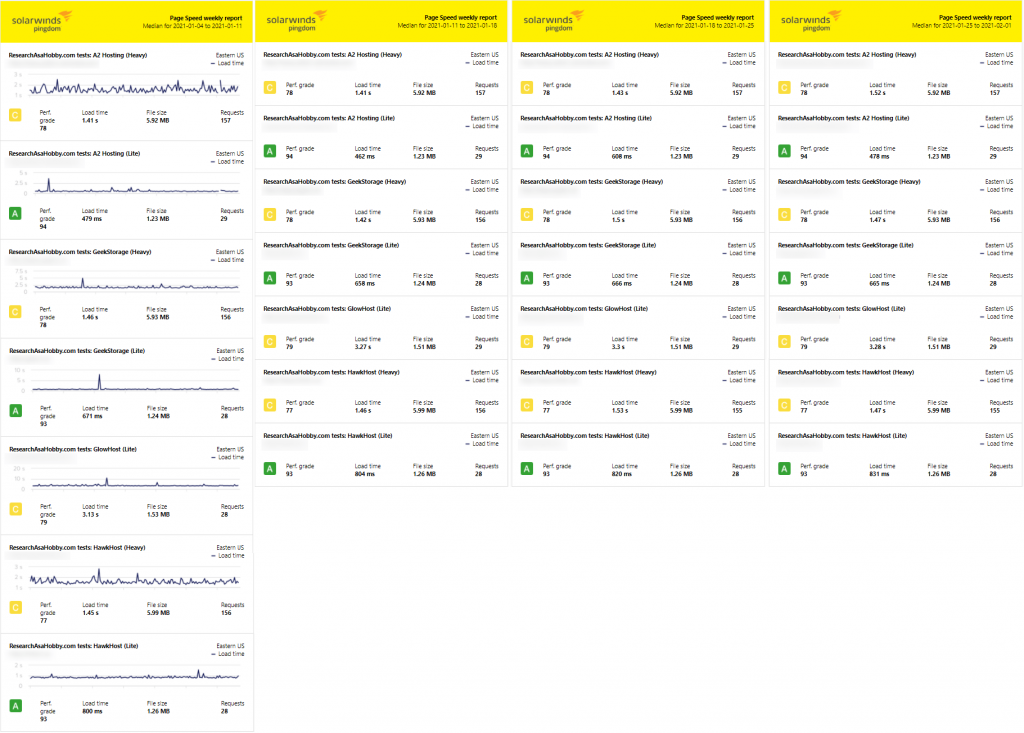
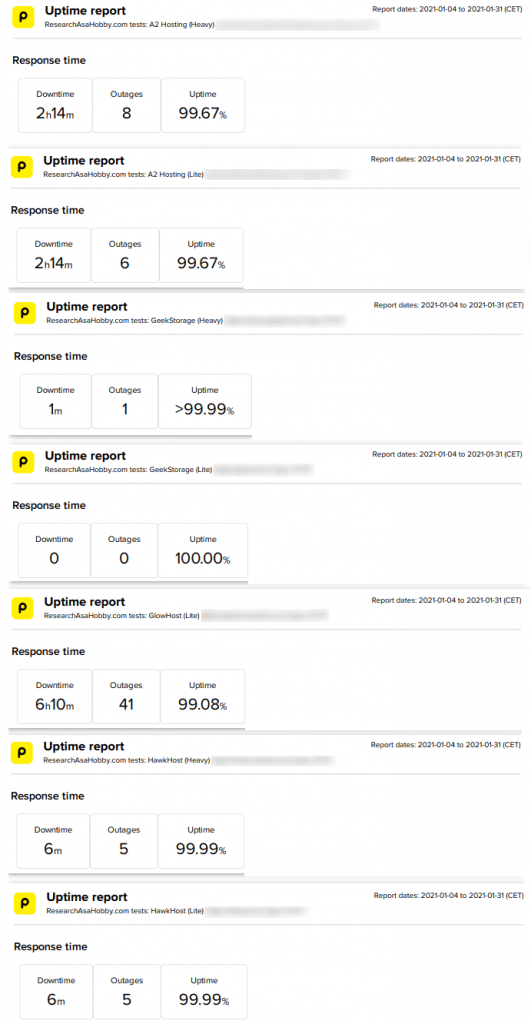
Here are the screenshot of the reports (I used this data for the charts and tables above):
These monitor checks are performed with 1-minute interval, which makes it great for detecting website uptime and downtime.
Full page load time (speed) reports:

Conclusion
The fastest host in January 2021 was A2Hosting for both Lite and Heavy installations. Although it did not have brilliant uptime this month.
GeekStorage and HawkHost were also very fast. There were no significant difference in speed with the leader. Uptime values of these hosts were also very high.
GlowHost was both very slow and had bad uptime.

BTW, I respect your privacy, and of course I don't send spam, affiliate offers or trade your emails. What I send is information that I consider useful.


There is lots of hosting available in the market but which one is best you see the review above.
I know these hosts and I like them more than others in this pricing segment, it’s true.