Intro
When people want to estimate hosting speed, they often use Server Response Time or Time To First Byte (TTFB) value. Whereas they should use Full Page Load Time metric.
And In this post I show you the data collected during the whole 2018 year on how fast the hosts were and how their speed is connected with Server Response Time (or Time To First Byte (TTFB) to be more specific).
Like my foundation article on this topic which I wrote two years ago, in this post I want to see the data proof of whether hosting speed has something to do with Server Response Time or TTFB.
If you want to read the theoretical part about what is Server Response Time, what is Time To First Byte (TTFB) and what it has to do with hosting speed (Full Page Load time) read the foundation article.
And in this article I focus on presenting the results of the 16.5 mln hosting speed tests and server response time tests.
So, like the previous article, this post is not a scientific research. But it has plenty of hosting speed and TTFB measurements (more than 16.5 million) and it allows drawing vivid conclusions based on easy-to-understand graphic presentation of data.
By the way, Time To First Byte (TTFB) is often used by many people and software as Server Response Time, so I use these terms interchangeably in this article. However, technically speaking, it’s TTFB, not Server Response Time.
I have enjoyed putting the results of the tests together and see how they look like on the charts. Hope you will enjoy it too!
General overview: TTFB vs Hosting Speed monitoring results
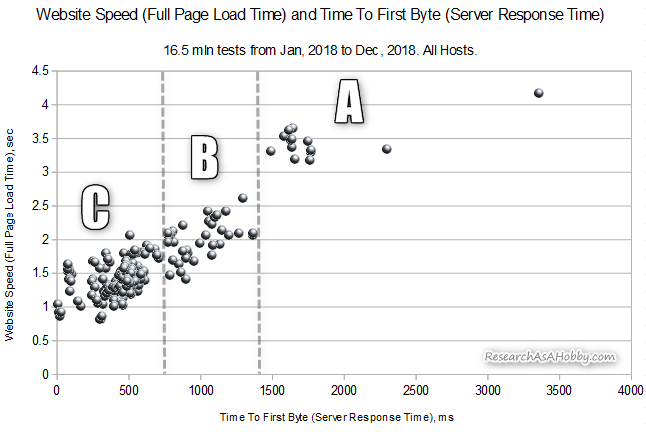
I’ve analyzed about 15.7 mln Time To First Byte (TTFB) or Server Response Time tests and 0.8 mln Full Page Load Time tests to see how website speed is connected with Server Response Time or TTFB. Here’s the chart that summarizes the measurements:
Each dot on the chart above represents an average performance of one of the 15 monitored hosts during one month. Thus, there are 12 dots (for 12 months of 2018) for each host on the charts. The performance is represented by two metrics: First Time To Byte (TTFB) or Server Response Time, and Full Page Load Time (website loading speed).
As you can see, in general there is a noticeable correlation (dependency) between Server Response Time (or TTFB) and website speed. It looks like the more TTFB the slower hosting.
Now let’s segment the data into some separate pieces. Will we notice any surprises? Let’s have a look.
Segmented overview: TTFB and Hosting Speed uncertainty
I’ve visually divided data on the chart into three sections: A, B and C.
In general, the distribution of the measurements is expected. I.e. the chart looks pretty normal for this kind of tests.
Let’s look at section “A” first. This is outsiders group. Time To First Byte (TTFB) is big – more than 1400ms. And hosting speed shows the worst values. However, even in this segment there’s no clear correlation – the bigger TTFB does not always mean the slower hosting speed .
Let’s move on.
I divided section B and C for further analysis (where I analyze each hosts separately). Section “B” represents the hosts which performed generally great. Section “C” represents even better performing hosts and the bigger (and more condensed) part of the measurements. Section “C” is the most interesting for my research since I focus on the best of the best hosting.
And for now let’s look at sections “B” and “C” together. We still can see the general tendency that the bigger TTFB, the slower hosting in this part. But the closer the values are to the left hand side of the chart, the greater variety of the hosting speed values is.
For now it seems like there’s a significant correlation between hosting speed and Server Response Time values (TTFB). And in fact there is. Does it mean that we can judge the hosting speed by measuring simply Server Response Time? Well… no! Only a superficial analysis can lead to such a fault conclusion.
In fact, there’s a serious nuance. It’s the following: These are the different hosts.
And as you will see below this is the killer argument. Every host does not reveal the same correlation pattern. In other words, different hosts have different dependency between Server Response Time (or TTFB) and the hosting speed. And only all hosts in general, if their tests are put together, do reveal the general rule that the less Server Response Time (TTFB), the faster hosting.
Now let’s add breakdown by hosting on the chart in the next section to see the most interesting details.
Per host view: Server Response Time (TTFB) and Hosting Speed performance
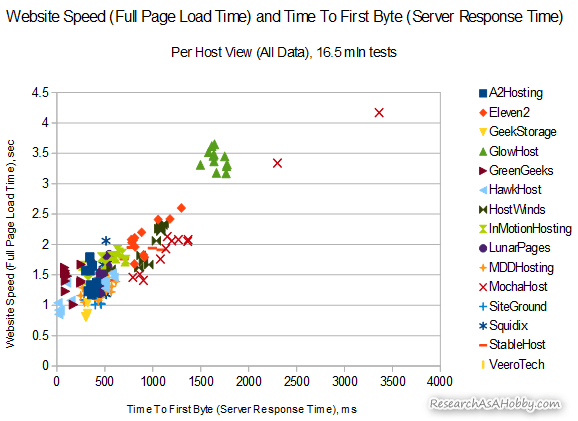
On the chart below I displayed the monitored hosts and how they performed monthly (click the image to enlarge):
Section “A” (Time To First Byte more than 1400 ms) contains mostly one host – GlowHost. Not surprisingly, this host has been taking the last place in my monthly Hosting Performance Contest very often.
As regards correlation between Server Response Time (or TTFB) and hosting speed, there’s no clear direct dependency.
Let’s have a look at the same chart but zoomed in:
Section “B” (Time To First Byte between 750 ms and 1400 ms) contains mostly just three hosts – MochaHost, Eleven2 and HostWinds. Although these hosts show comparatively bad Time To First Byte (TTFB), their speed is quite average.
As regards correlation between Server Response Time (or TTFB) and hosting speed, there is clear dependency. In this segment better Server Response Time (or TTFB) means better hosting speed.
Here’s also the same chart as above but limited by 750 ms Server Response Time (TTFB):
Section “C” (Time To First Byte below 750 ms) is pretty diversified. There’s even weaker correlation between Time To First Byte (TTFB) and hosting speed. And as regards individual hosts, the correlation is practically not noticeable at all.
Hosts with the same TTFB throughout the months may show different hosting speed. And the hosts with the same speed may show different Server Response Time (TTFB).
And even some hosts show that better Server Response Time (TTFB) may mean worse hosting speed. Thus, there’s not solid dependency between Server response Time (or TTFB) and hosting speed.
Here are the individual charts below for each hosting. So that you could see how different the distribution of measurements are across the hosts. There’s no one single rule that can describe the dependency between Server Response Time (or TTFB) and hosting speed that would work equally well for each and every host.
However, if all the hosts are treated like one hosting (for theoretical purpose), then it looks like there‘s the clear dependency between Server Response Time (TTFB) and hosting speed – the less Server Response Time the better hosting speed. But as you could see above, this rule is mistaken if you want to apply to a single host.
Have a look at the charts (you can click it to enlarge):
Best hosts according to TTFB and Full Page Load Time tests
Let’s see now the hosts which have been performing the best among the 15 monitored hosts. To comply with the criteria I selected in my initial article so that it could be easier to compare, I’ve selected on the chart only those hosting performance observations which were faster than 600 ms Time To First Byte (TTFB) and faster than 1.5 seconds Full Page Load Time (website loading time):
In the table below I put together these hosts with their scores. A score for a host represents how often the host gets into this high-performance section.
For example, score “9 out of 12” means that during 9 out of 12 months in 2018 the host performed exceptionally well (i.e. hosting speed was below 1.5 seconds and Server Response Time (marked as TTFB) was below 600 ms).
All my recommended hosts are on this page (and “My review / Read” links in the table above go to this page with my recommended hosts to a selected hosting review as well).
I also suggest looking at more details how these and some other hosts performed every month.
If you want to see each and every monthly report on the hosts performance (including Time To First Byte data), go here.
If you’d like to know the winners of the monthly hosting Contest, go here.
Take-aways
According to my data set for the 15 hosts I’ve been monitoring, Time To First Byte (TTFB) and Full Page Load Time (or hosting speed) show some correlation. At the same time it depends on a particular host and the TTFB value.
If Time To First Byte (TTFB) is relatively slow (more than 750 ms), then TTFB is significantly correlated with hosting speed (i.e. website loading speed measured via Full Page Load Time tests). The more TTFB the slower hosting. But note that only few hosts have got into this category.
And if TTFB is within the most frequent range (below 750 ms), then the correlation between TTFB and hosting speed is not significant. Some hosts even show negative correlation (better TTFB leads to worse hosting speed). And many hosts show different hosting speed when their TTFB does not change.
After all, the rule “The smaller TTFB goes together with faster hosting” does work from a generally statistical point of view if all hosts are treated like one host. But when analyzing each host individually, there’s no such correlation. And here are even more important notes:
- This is just correlation, not causation. In other words, if you make TTFB faster (or if you choose a hosting with a faster TTFB) it does not guarantee that your website will be faster with this host compared to other host with lower TTFB.
- Each host has its own pattern of dependency between TTFB and hosting speed. In other words, hosting speed may fluctuate when TTFB stays the same or almost the same.
- There are other factors which affect hosting speed greatly rather than TTFB. As a result, some hosts may show better TTFB but final website loading time may become worse. And vice versa: worse TTFB may go along with better website loading time at the same hosting.
Conclusion
If you have not done it yet, I suggest reading take-aways of the section above.
And if you want a super-very short summary of the whole article, here it is:
- Be aware of that the terms like Server Response Time or Time To First Byte (TTFB) can be used differently by different sources.
- The smaller TTFB the better, but this rule is not strict and depends on a lot of factors (including caching options or firewalls/CDN).
- Even within one hosting a better TTFB does not always mean better website loading time.
- Speed of shared hosting is subject to many other factors (e.g. performance boost options) which affect it. So TTFB is far not a major factor.
- I’ve run more than 16.5 mln tests on 15 hosts during 12 months of 2018. Here are the take-aways. TTFB less than 750 ms is quite normal (most measurements fall into this range). And TTFB more than 1400 ms is not good sign.
- The best three hosts which show the smallest TTFB and the fastest loading speed (in the period from Jan 2018 to Dec 2018) are GeekStorage (12 out of 12 scores), SiteGround (12 out of 12 scores) and the third palce is taken by two hosts with the same score – 11 out of 12: HawkHost and MDDHosting. More details are above.
P.S.: Note that fast hosting with great support is just a part of the successful foundation of your online business. Strong website security and reliable backup solution are the other two major components of your strategic technical advantage.

BTW, I respect your privacy, and of course I don't send spam, affiliate offers or trade your emails. What I send is information that I consider useful.


