Intro
It’s quite a common mistake to measure hosting speed by checking Server Response Time or Time To First Byte (TTFB). The right way to test hosting speed is measuring Full Page Load Time. And although Server Response Time is connected with hosting speed, it’s absolutely not correct to use TTFB for evaluating hosting speed.
In this article I will demonstrate you this. I have collected the results of 16.5 million tests for this article. There’s the data on the hosting speed (Full Page Load Time to be specific), Time To First Byte (TTFB) which is called sometimes Server Response Time. It will let us see in this post the connections between these two metrics. The data is for the 15 hosts that I have been monitoring during the whole year 2019.
Three years ago I wrote a foundation article about the interconnections between Server Response Time (or TTFB) and hosting speed. That article contains the theoretical part of TTFB, Full Page Load Time. But it also contains real-life hosting speed data and the TTFB test data that I gather with an application performance monitoring service. Particularly, when writing the article I collected and analyzed the data of 2016. It helped me to make the research conclusions at that time, the new testing data helps me to draw conclusions this year too.
So, after two years I decided to re-check the conclusions I made in the initial research about how Server Response Time affects hosting speed judging by real-life data. And then this post appeared for the data of year 2018. And the new data set of the whole year proved the main dependency between Time To First Byte (Server Response Time) and Hosting speed.
And when 2019 ended, I made a research using the same approaches but using the data collected in 2019. And this is what this post is about, i.e. whether you can estimate a hosting speed by checking only Time To First Byte (or Server Response Time). 15 hosts tested with 16.5 million tests.
I always like to put data together and see what stories they tell with the charts. And I can’t wait to show you the results. Let’s go!
General overview: Server Response Time (TTFB) vs Hosting Speed monitoring results
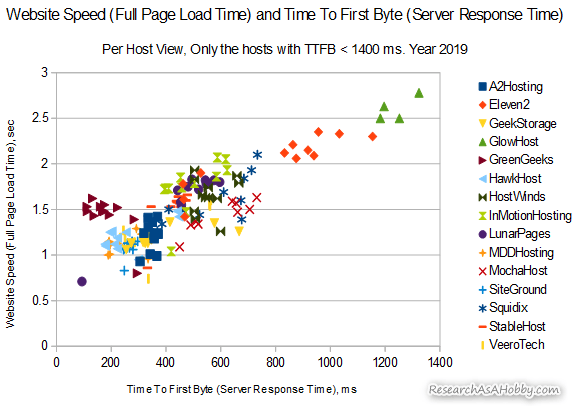
I’ve analyzed about 15.7 mln Time To First Byte (TTFB) or Server Response Time tests and 0.8 mln Full Page Load Time (hosting speed) tests to see how the speed is connected with Server Response Time (TTFB). Here’s the chart that summarizes the measurements:
I took each host’s average month performance. The performance is represented by Full Page Load Time (website speed hosted on a particular hosting) and Server Response Time (Time To First Byte). This pair of metrics is marked it as one dot on the chart above. There are 15 hosts that I have been testing and 12 months of 2019. 15 x 12 = 180 dots.
As you can see on the chart, generally there is a correlation (dependency) between Server Response Time (or Time To First Byte) and the website speed (Full Page Load Time). Very roughly, the bigger TTFB the slower hosting. But there’s also a significant concentration and wider distribution of dots in the left part of the chart. This is where the things are interesting.
By and large, the general test results of speed vs TTFB looks similar to what I had in the previous years. But the performance of particular hosts changed. Some details also changed. In this year there are more examples when the general rule (“the better TTFB the better hosting speed”) gets broken.
Let’s break the general chart into segments like I used to in the previous years do and see the particularities. These particularities are more important than the general bird-eye conclusion about TTFB vs hosting speed relations.
Segmented overview: Server Response Time and Hosting Speed uncertainty
As in previous years, it makes sense to divide this year’s data on the chart into three sections: A, B and C.
In general, the distribution of the TTFB vs Hosting speed data pints is as expected. I.e. the chart looks logical from the first sight – worse Server Response Time accompanies slower hosting speed:

The sections of average monthly data of all the monitored hosts: Server Response Time and Full Page Load Time
Let’s look at the section “A” first. This is the outsiders’ group. Server Response Time, or Time To First Byte (TTFB) is big – more than 1400ms and visually quite distinguishable from the other part of the data set. And these measurements also contain the worst hosting speed values.
However, in this segment there’s no strong dependency which would let us say that bigger Response Time (TTFB) mean worse hosting speed. There is almost a half of the values break the general belief “the better TTFB the better hosting speed”. And since this section “A” is not very representative in terms of the number of TTFB/Hosting speed values, we may not emphasize too much on it.
Let’s move on.
For more detailed analysis of “TTFB / Hosting speed” relationship I outlined sections B and C. Well performing hosts Section “B” represents the hosts which performed generally great. Section “C” represents even better performing hosts are in the section “B” and the best performing hosts are in the section “C”. As you can see the section “C” contains a bigger number of values and the distribution of them is not clearly determined.
In other words, the section “C” is the most interesting and contains not so evident dependencies between Server response Time (TTFB) and hosting speed.
For now let’s look at sections “B” and “C” together. Although a general assumption (“the better TTFB the better hosting speed”) is sort of visible on the chart, there’s an important point. The issue is that the less TTFB the less this assumption works. And at the very left part of the chart the tendency becomes even the opposite (it becomes “the worse TTFB the better hosting speed”). But let’s eat one piece at a time.
Also, there’s a nuance. It’s the following: The values displayed on the chart do NOT belong to one hosting, but to multiple hosts . It means that we need to pay attention to each host individually to understand whether the assumption “the better TTFB the better hosting speed” is correct.
I will give you a spoiler now. It will help you understand the things easier. And as you will see below, when hosts are examined individually, they do not reveal the same correlation pattern. In other words, different hosts have different dependencies between Server Response Time (TTFB) and the hosting speed. In very short it means “faster TTFB does not mean better speed in many cases”.
It’s time to distinguish different hosts on the chart. It will let you see the interesting details. Let’s move to the next chapter!
Per host view: Server Response Time (TTFB) and Hosting Speed performance
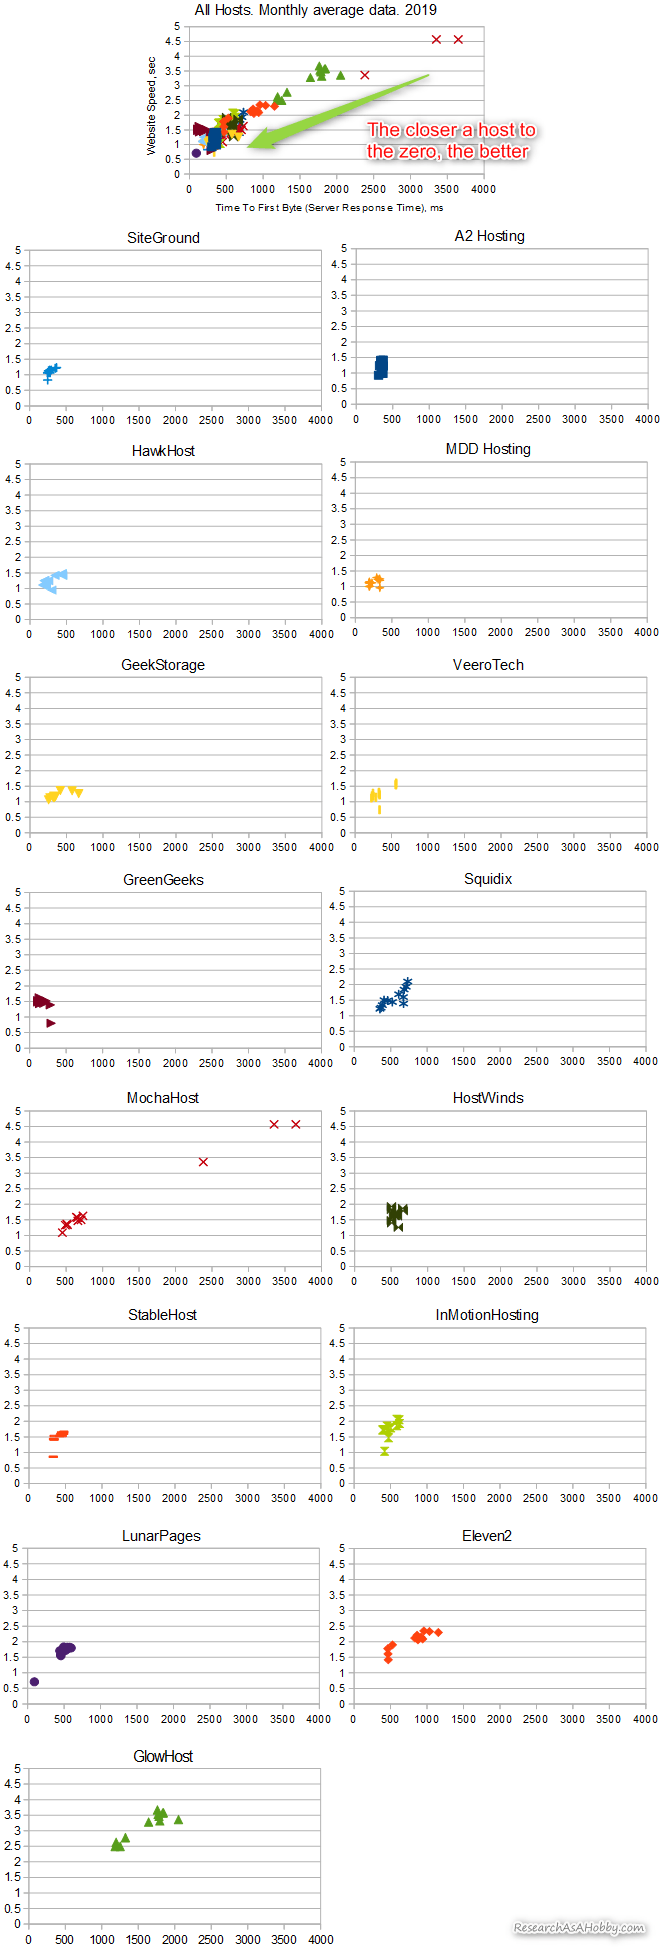
Here’s the chart which displays the monthly performance of the monitored hosts. Each dot is a hosting’s performance in a certain month. (The image is clickable)
Section “A” (where Server response Time or TTFB is more than 1400 ms) contains mostly one host – GlowHost and partly MochaHost. These two hosts have taken the last places in my monthly Hosting Performance Contest very often.
If you look at that chart part, you will not notice a clear linear dependency between Server Response Time (or TTFB) and hosting speed.
Now let’s have a look at the same chart but without the outsider part:
Section “B” (Time To First Byte between 750 ms and 1400 ms) contains just two hosts –Eleven2 and GlowHost.
There is a noticeable linear dependency between TTFB and the hosting speed in this section “B”. But since there’s not so many hosting measurements that got into this section, it’s not enough to make a conclusion. The sections “A” and “B” do not contain many TTFB/speed measurements. But at the same time these sections reveal the existence of a linear dependency “the more TTFB the worse the hosting speed”. But this works only if Server Response Time (TTFB) is quite large (in my case, more than 1400 ms).
Most measurements get into section “C”. This section is limited by 750 ms Server Response Time (TTFB):
Section “C” (Time To First Byte below 750 ms) is pretty diversified. There’s even weaker correlation between Server Response Time (TTFB) and hosting speed. The diversity is much higher and the liner dependency does provide the best model. And as regards individual hosts, the correlation “bigger TTFB means worse speed” is not correct in most cases.
The point is that different hosts may have their own model of dependency between Server Response Time and the speed. And the host with the same same Server Response Time (TTFB) may have different hosting speed. And also the hosts with the same speed may have different Server Response Time (TTFB).
What is more interesting is that some hosts may reveal that hosting speed may fluctuate much more than Server Response Time (TTFB) . Thus, there’s not solid dependency between Server response Time (or TTFB) and hosting speed.
You can enjoy the individual charts for each hosting below. They will let you understand that the hosts speed and Server Response Time may fluctuate differently. There’s no one dependency rule that can work well for each and every host for describing the relation between Server Response Time (or TTFB) and hosting speed.
At the same time, if all the hosts are treated like one hosting (for theoretical purpose), then it looks like there‘s more or less distinguishable dependency between Server Response Time (TTFB) and hosting speed. It says “the less Server Response Time the better hosting speed”. But as you can see on the charts this rule works worse and stops working at all as TTFB becomes less. In other words, better performing hosts do not reveal a noticeable dependency between TTFB and the speed.
Here are the charts for each host (the image is clickable):
Best hosts according to TTFB and Full Page Load Time tests
In this section you can see the best examples of how the 15 hosts performed in the months of 2019. I selected the same ranges of Server Response Time (TTFB) and hosting speed as in the previous years. I.e. the chart contains only the hosting performance observations which had Server Response Time (TTFB) better than 600 ms and Full Page Load Time (hosting speed) faster than 1.5 seconds:
Also, for a summary purpose I put together the scores of the hosts. A score for a host displays how often the host got into this high-performance section in 2019.
For example, score “9 out of 12” means that during 9 out of 12 months in 2019 the host performed exceptionally well (i.e. hosting speed (monthly average Full Page Load Time) was below 1.5 seconds and Server Response Time (Time To First Byte or TTFB) was below 600 ms).
All my recommended hosts are on this page (and “My review / Read” links in the table above go to this page with my recommended hosts to a selected hosting review as well).
I also suggest looking at more details how these and some other hosts performed every month during 2019 and in the previous years.
If you want to see each and every monthly report on the hosts performance (including Time To First Byte data), go here.
Take-aways and conclusions
The data set that I’ve got in 2019 for the 15 hosts shows that Server Response Time (or Time To First Byte, TTFB) and Full Page Load Time (or hosting speed) show some correlation in general. But at the same time there’s no linear correlation if we analyze a hosting separately.
If Server Response Time (or TTFB) is relatively slow (more than 750 ms), then TTFB is noticeably correlated with the hosting speed (the speed is measured as Full Page Load Time). The more TTFB the slower hosting. But note that only few hosts have got into this category.
But if Server Response Time (or TTFB) is less than 750 ms (most measurements get in this range by the way), then the assumed correlation between Server Response Time (TTFB) and hosting speed does not really exist. Some hosts may show an expected linear correlation though, but in most cases TTFB does not affect the speed of the hosts.
After all, the assumed rule “The better Server Response Time (or TTFB) accompanies faster hosting” does work from a statistical point of view if all hosts are treated like one host, BUT only for the hosts with the slowest speed. However, if each host is analyzed individually, then there’s no such dependancy.
Also, here are some more important notes:
- Please note that what you see in this post is the talk about correlation, not causation. In other words, if you improve Server Response Time (TTFB), or if you decide to use a hosting with better TTFB, it does not guarantee that your website will be faster with this host compared to other host with worse TTFB.
- Each host has its own pattern of correlation between Server Response Time (or FFTB) and the hosting speed. In other words, hosting speed may fluctuate whereas Server Response Time (TTFB) may stay more or less the same. And also TTFB can fluctuate and not affecting the hosting speed.
- There are other factors which influence the hosting speed. As a result, some hosts may show better Server Response Time (or TTFB) but final website loading time (i.e. hosting speed) may become worse or not change much. And vice versa scenario also possible: worse TTFB and better website speed may go hand in hand at the same hosting.
And here’s a very short summary of the whole article:
- Be aware of that the terms Server Response Time or Time To First Byte (TTFB) can be used as something seriously affecting hosting speed. In fact this relationship is very limited and can be discarded in most cases if you evaluate a hosting speed.
- In common sense, the smaller Server Response Time (or TTFB), the better. But this rule is not strict and depends on too many factors (including caching options or firewalls/CDN).
- It makes no practical sense to evaluate hosting speed by TTFB, especially if TTFB is less than 750 ms or so.
- Speed of shared hosting depends on many factors (e.g. performance boost options that some hosts offer ). And Server Response Time is not even a factor to consider.
- I’ve run more than 16.5 mln tests on 15 hosts during 12 months of 2019. Here are the super-short data-related take-aways. Server Response Time (or TTFB) less than 750 ms is quite normal (most measurements fall into this range). And TTFB slower than 1400 ms is not a good sign if you evaluate a hosting speed.
- The best hosts which show the smallest Server Response Time (TTFB) and the fastest speed (in the period from January 2019 to December 2019) are SiteGround, A2 Hosting, HawkHost and MDDHosting. All these hosts took 12 out of 12 scores. More details are above.
P.S.: Note that fast hosting with great support is just a part of the successful website from a technical point if view. Your website’s security which is often not a hosting task, as well as backup solution are the other two major components of your strategic technical advantage.

BTW, I respect your privacy, and of course I don't send spam, affiliate offers or trade your emails. What I send is information that I consider useful.


Micheal,
Thanks for depicting the fact. But, when we test the speed using GTmetrix or Google Page Speed Insights, there will be suggestions to improve the server response time to improve site overall loading speed. In what criteria, it makes sense?
Jessica, it does make sense to improve server response time (SRT) if it improves the the overall site loading time AND if it does not complicate the website management and maintenance as a result of it. And it does NOT make sense to improve SRT just to see better GTMetrix rating 🙂
Thanks for the above information. Is server response time also depends on the distance of host from your locality? How much it affects.
Not the distance actually affects the server response time, but the quality of network from the server to a visitor (or to a testing location).
Okk thank you for your answer.
No problem!