


SiteGround and A2 Hosting are the most popular hosts among the readers of my blog. And in this research I decided to dig into the speed performance of these hosts even deeper than I have ever done and ever seen before! You will see the most detailed hosting speed data that I have access to.
From this research you will know:
- The most realistic understanding of how slow and fast SiteGround and A2 Hosting can be (short –time slowdowns and typical real-life speed level).
- The most detailed overview of real-time speed performance of SiteGround and A2 Hosting for 6 months (tests run continuously with 20-min intervals from two US locations).
- Analysis of SiteGround and A2 Hosting speed details and particularities.
And yes, this research is based on the real speed tests (Full Page Load Time), not Server Response Time or Time To First Byte tests which should NOT be used for evaluating the hosting speed.
If you choose a hosting between SiteGround and A2, I suggest reading my reviews of the hosts there: SiteGround review and A2 Hosting review).
How I tested SiteGround and A2 Hosting speed and analyzed the data
Why I made this research
You probably already know that I monitor hosts in real time and publish monthly reports on hosting performance. These reports are extremely useful because they are based on the objective hosting speed which is measured every 20 minutes from two different USA locations. Although there are 4400 speed tests done for each tested host every month, these monthly reports are not detailed enough – only monthly average speed of the hosts is presented.
Also, recently I published a yearly report with the details and the charts which display average daily speed of SiteGround in comparison with other hosts. The information presented there is more detailed. You can see the daily average speed of 15 hosts including SiteGround and A2 Hosting.
Average daily data is the most detailed data I can get via the automated reports provided by monitis.com. It’s the hosting monitoring service that I use. But I wanted to show you even more detailed speed data on A2Hosting and SiteGround. The more details you know, the more realistic view on SiteGround or A2 Hosting speed you can get. That’s why I downloaded and processed the raw speed test data from the hosting monitoring system to present the speed data to you. See more on that below.
And finally, the more data is analyzed, the better. Single speed tests are very unreliable and can be greatly misleading. That’s why I monitor the hosting speed continuously and delivering you the reports and researches like that – to let you know the as much reliable results and conclusions as possible.
The methodology of comparison A2 Hosting and SiteGround speed
Here’ s an overview of what I did to compare the speed of A2 Hosting and SiteGround.
- I’m using the most affordable shared hosting plans with A2 Hosting (the server is located in the USA, Los-Angeles) and SiteGround (the server is located in the USA, Chicago). On both hosts I installed a WordPress website. I added a dozen of articles of a thousand of so words with images to each site which all display on the front page. I don’t use any caching plugins or any other caching solutions on these testing sites for more objective results.
- I’m using monitis.com service to monitor the speed (Full Page load Time) of the both websites. The tests run every 20 minutes from two locations. More details on how I monitor the websites’ performance is here.
- I downloaded the SCV files with the raw speed testing data (all available speed tests of SiteGround and A2 Hosting from the hosting monitoring service I use). It includes data from the two test locations: US West (Los-Angeles, California) and US East (New York). Each test locations run speed tests every 20 minutes. The data set includes speed tests from July 2019 to December 2019 inclusive. There are totally more than 52,000 speed tests downloaded.
- I put together the data in a spreadsheet, built some of the charts. The raw data contains the speed test from the two locations for each host. And it includes all registered momentous speed peaks (and you can see them on the charts in the research).
By the way, if you want to see the charts displaying original individual real-time and historic speed test values yourself, you can do it at the charts which are located below my reviews for SiteGround and for A2 Hosting).
- But I also needed to get aggregated speed of each host like if it were tested from just one “general” location. I calculated this data as a function of a minimum of the speed values from the both test locations. The “minimum” is just one of the possible options of aggregating data. And I chose “minimum” as an additional perspective to the more “average” approach that monitis.com takes with the daily and monthly reports that I already presented in my another research.
Thus, for this new research, in addition to the original data with all the registered speed peaks at the single tests locations, I also got the hosting speed results regardless of the test locations. The “minimum speed” approach eradicated most speed peaks from the single tests when aggregating data for each host. And it made the hosting speed look slightly better on the aggregated charts (with no test locations) than on the charts with original data (with the test locations).
Both kinds of charts (the original speed tests with all the peaks provided from the test locations) and the aggregated speed data (“minimized” speed peaks without specific test locations for easier analysis) are presented in this article, so you have the best of the both approaches. In combination with my other research which displays the “average” speed data you can get as full understanding about the hosting performance as possible.
Also, I built multiple histograms to analyze speed of A2 Hosting and SiteGround from different perspectives.
Charts to analyze which host is faster – A2 Hosting or SiteGround
I present the results of my “Who is faster: SiteGround or A2 Hosting speed” research in numerous charts that you will see below.
The most detailed 20-min charts: A2 Hosting vs SiteGround speed
In this chapter you will see the charts that I built using the raw data. The data includes all the registered peaks from both test locations. These are the most detailed hosting speed charts (for 6 months at once and for each of the months separately) for each host.
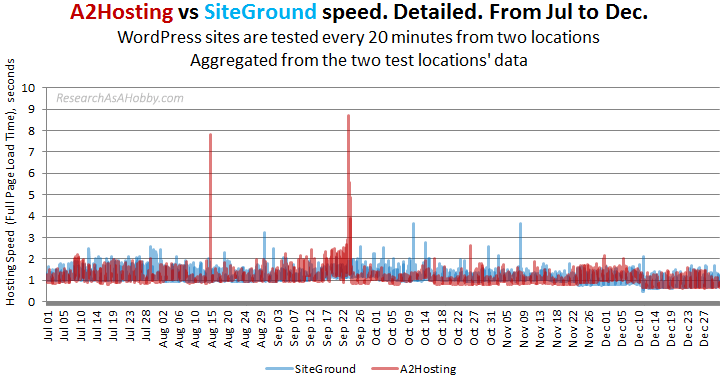
Who is faster – SiteGround or A2 Hosting, from July to December from two locations
On the two combined chart below you can see all the sped data I got for this reserch. The limitations of the charts os obvious – there are too many data (52+K speed values in total) to display on the charts for detailed analysis. Single speed tests are hardly visible. But single peaks are visible great.
So, a bird-eye overview of the speed performance of A2 Hosting and SiteGround separately.
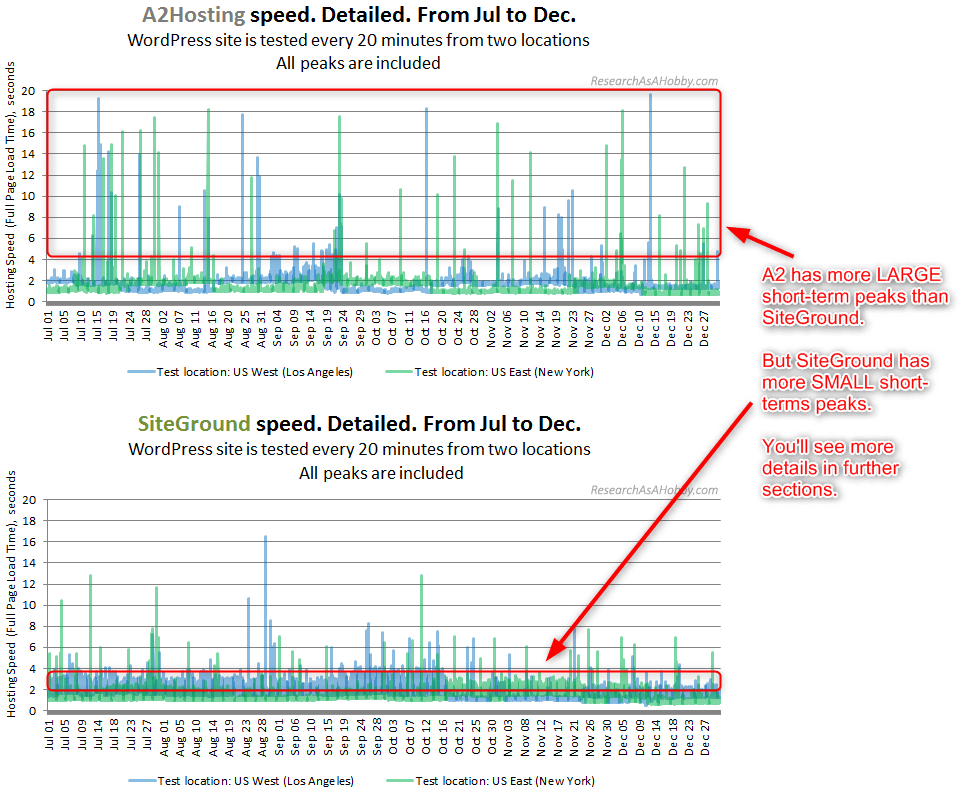
I’ve put a note on the chart above with the main insight that this chart brings. I.e. A2 Hosting demonstrates a noticeably bigger number of single slow-speed peaks than SiteGround. At the same time A2 Hosting has a less number of smaller speed peaks than SiteGround.
I have to mention that both larger and smaller peaks do not affect a general monthly speed as much as it may seem. But it speaks quite well about the difference in hosting approaches. A2 is focused on better speed most of the time. But it can allow single and uncontrollable peaks happen now and then. SiteGround is focused more on avoiding big speed peaks. But it has a bigger number of numerous controllable peaks (less than 4 seconds).
Also, here is something I’d like to mention.
First of all, displaying dozens of thousands of values on a chart like that (too little space on the charts to display all the data clearly) does not allow to see the single speed values. But the chart allows emphasizing the peaks very well. Actually, it looks like the whole chart contains of the smaller and bigger peaks. Single normal values just meld together and become hidden behind the small and larger peaks. Just keep it in mind when looking at the charts with tons of values displayed on them.
In other sections below you will find histograms which outline the smaller speed values too. Whereas the charts with chronologically ordered speed values for the 6 months at once and for each month separately are good mostly for analyzing peaks.
The tests from two test locations may seem confusing. Just keep in mind that hosting speed is not that can be actually measured precisely. There are quite a number of factors that stand on the way. For example, the speed tests can’t be taken every second (it’s too expensive). At the same time, no one knows what happens with hosting speed between the tests in the 20-minute intervals (the host may have better or worse speed). But a big number of tests that I made allows to estimate the speed performance of the hosts very objectively (exactly that’s to a big number of tests)
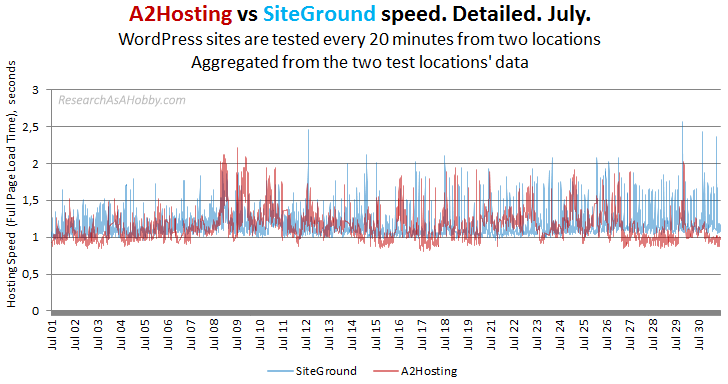
SiteGround vs A2 Hosting speed in July from two locations
Here are the combined charts with speed of SiteGround and A2 Hosting for July:
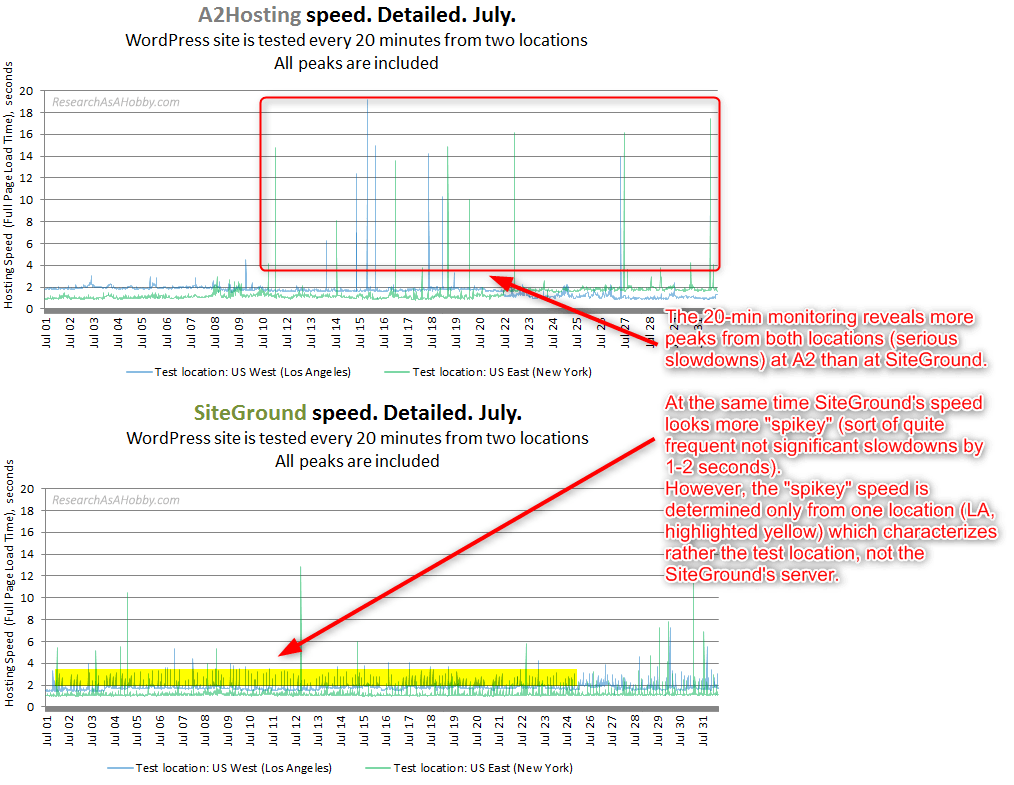
The speed tests run every 20 minutes at both locations. And as you can see these tests reveal a bigger number of slowdowns (the peaks on the charts) for A2 Hosting compared to SiteGround. On the one hand it looks like the number of peaks is not large (and it’s NOT large indeed). The chart contains 4300 tests and there are just approximately 20 speed peaks.
On the other hand the tests run not constantly, but just once per 20 minutes on each location. It means that the real number of slowdowns is considerably bigger in reality. Anyway, the chart shows there are chances of getting a slow short-time speed at A2 Hosting.
Compared to A2 Hosting, SiteGround looks healthier from speed stability point of view. But at the same time we can see that there are numerous insignificant speed slowdowns registered from one of the locations (US West, LA). On the chart its looks like a “spiky” line.
It’s interesting to note that each spike is registered mostly at one of the locations, not at both locations at the same time. It’s an indicator that the testing location may be in charge of the spiky behavior, not the SiteGround’s server is in fault.
Further analysis (see the charts blow for other months) shows indeed that the small spikes do take place only at one of the test locations most of the time. If SIteGround had some issues with the server, the spikes would have been registered from both test locations all the time.
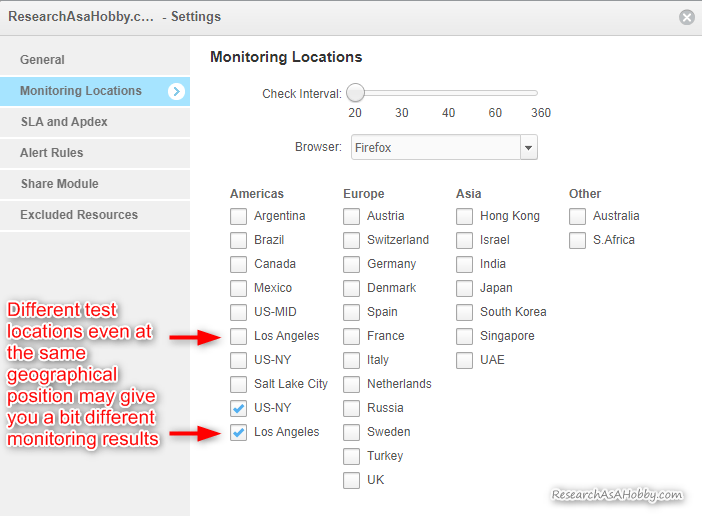
Besides, A2 Hosting does not show this sort of “spiky” behavior at any of the test locations. The explanation is quite simple, although a bit hidden from the end-user. There are different test locations in fact at Los Angeles (different virtual environments, probably different servers), although they are both located in the same geographic area.
Such little aspects reveal that the interpretation of the monitoring results is also as important as the monitoring results. My aim is to share with you not only my interpretations, but also show you the data that I analyze so that you could make your own conclusions.
This analysis is based only on one month only, but as you see further, other months also confirm these conclusions in general.
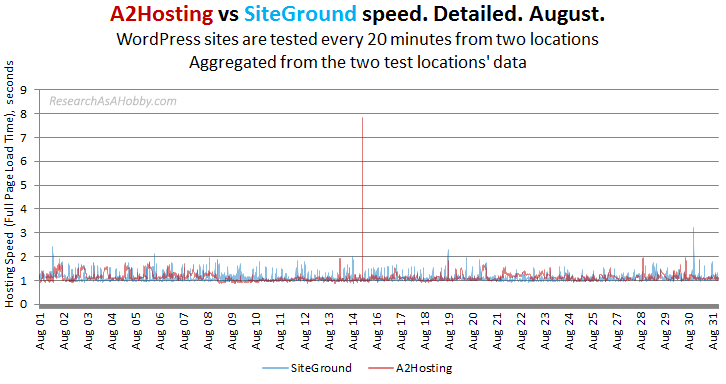
SiteGround vs A2 Hosting speed in August from two locations
Here’s the chart to compare the 20-min speed checks of SiteGround and A2 Hosting in August:
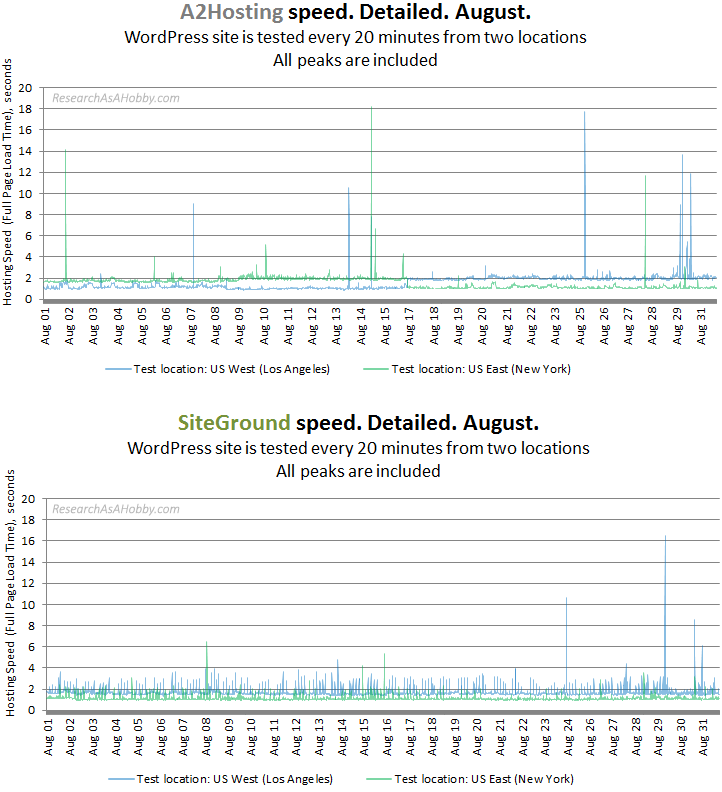
The same analysis applies to August as in July described above. The main difference is that this month A2 Hosting had less momentous slowdowns registered than in July.
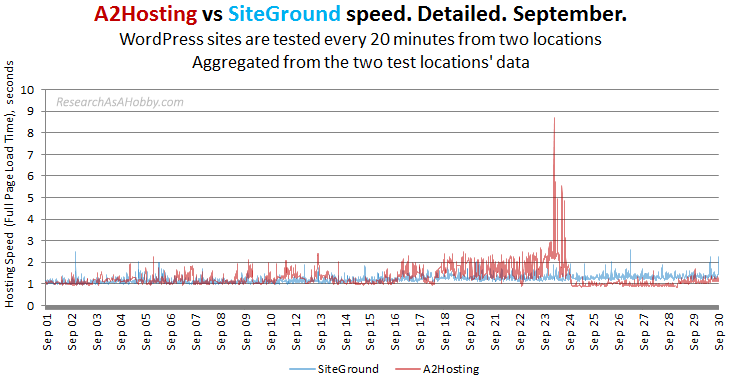
SiteGround vs A2 Hosting speed in September from two locations
The charts with A2 Hosting and SiteGround speed:
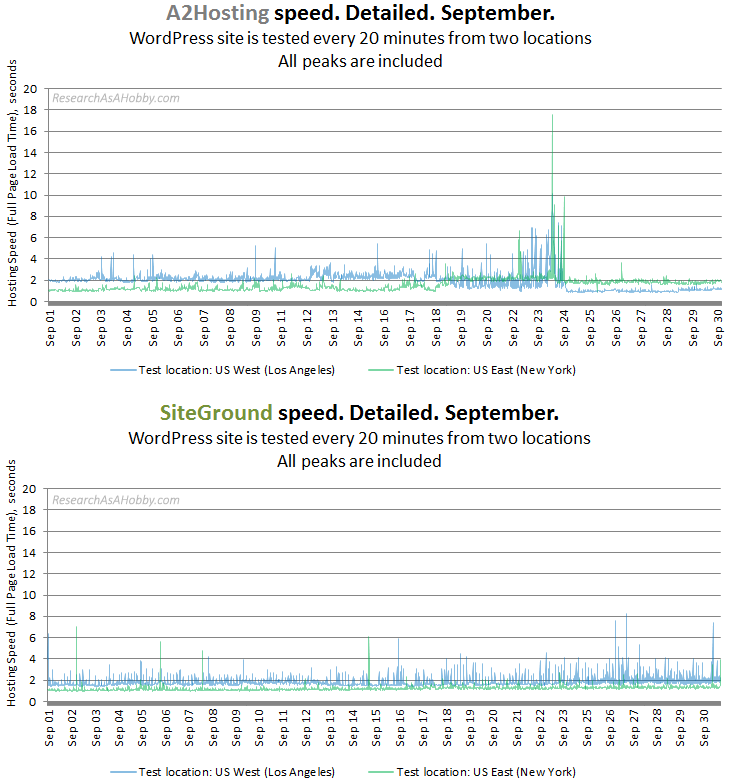
SiteGround goes on fine with the same pattern as described above in the July section. The spiky speed registered only for one test location which is an indicator of the US-West test location being unstable, not that SiteGround has issues.
As regards A2 Hosting speed in this month, both locations show instability on the 23d and especially on the 24th of September. Although it was not a permanent slowdown on those days, but there were some comparatively frequent issues.
Between the 18th and the 22nd of September A2 had increased speed. You can see that the US East test location shows speed increase by nearly 1 second, and the US-West location shows increased instability. This is enough to conclude that there were some issues with A2 speed, although the speed increase was not critical and under control.
SiteGround vs A2 Hosting speed in October from two locations
Here is the chart with the displayed speed of A2 Hosting and SiteGround in October:
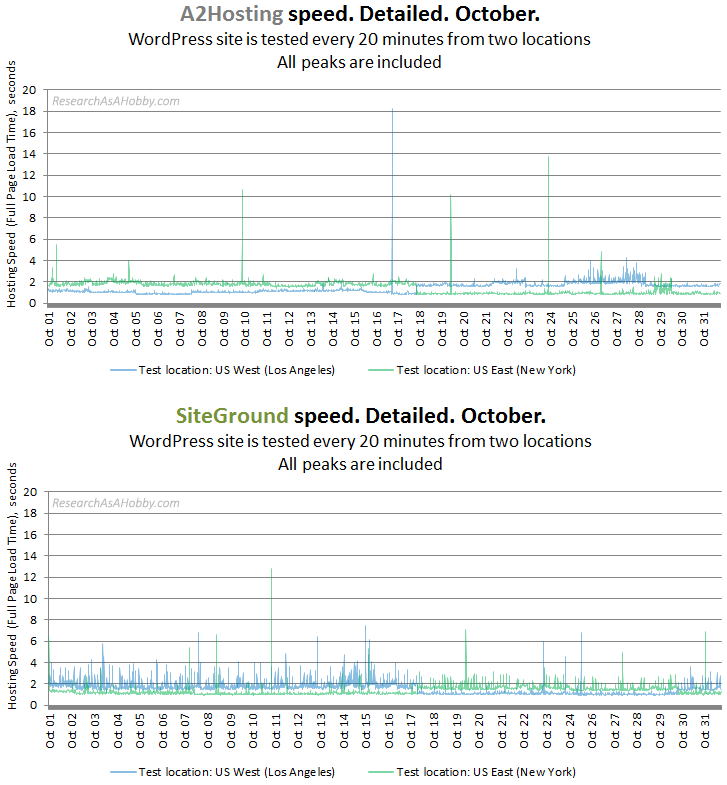
It was quite a calm month. A2 Hosting had just few occasional peaks. And SiteGround, as usual did not have simultaneous instability (“spikes”) at both test locations.
SiteGround vs A2 Hosting speed in November from two locations
Here is the chart with the displayed speed of A2 Hosting and SiteGround in November:
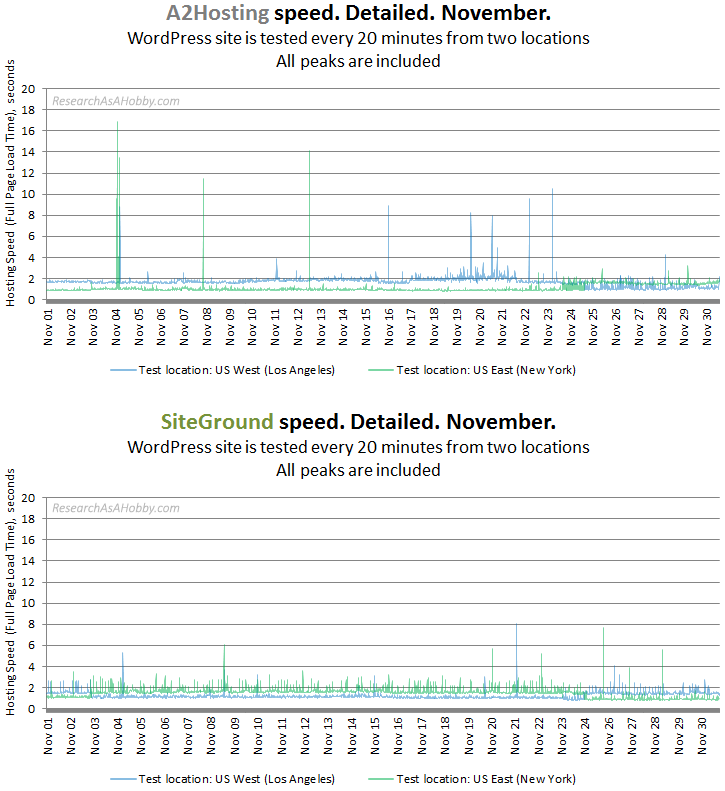
SiteGround demonstrated quite stable performance as usual. No simultaneous “spiky” behavior at the both test locations. Which is good.
A2 Hosting also performed very well. There were a few occasional peaks. Also there were some days with spikes (24-29th of Nov) which is not typically for A2. But anyway the spikes were not serious to bother about.
SiteGround vs A2 Hosting speed in December from two locations
And here goes the chart with the speed of A2 Hosting and SiteGround in December:
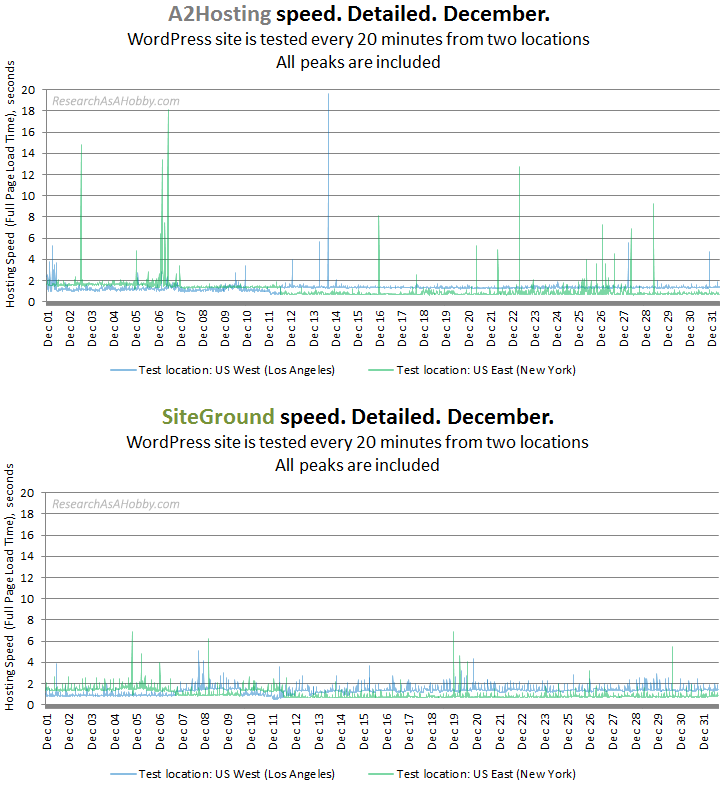
The speed of SiteGround continues to be quite smooth this month in general. But there were not significant instability on the 8th and the 19th of December. You can notice a small area of simultaneous spikes at both locations on those two days.
As regards A2 Hosting, its speed was a bit less stable than SiteGround in general. But there were no any serious speed issues.
A2 Hosting and SiteGround 20-min speed charts with aggregated locations’ values
You can compare speed of SiteGround and A2 Hosting using the charts above. It is the most precise way. But multiple test locations may confuse some people. That’s why in this chapter I also display the speed comparison in a classic way – both hosts on one chart.
In the methodology above I explained how I got the aggregated speed for each hosting using the data from multiple test locations. Although this is a bit simplified way of comparing the hosts, it still makes a lot of sense as it gives side-by-side hosting speed comparison.
Who is faster – SIteGround or A2 Hosting from July to December, aggregated location
Here’s the 20-min chart with A2 Hosting and SiteGround speed for 6 months.
As you can see in general, the speed performance is comparable. The conclusions I made in the previous chapter are confirmed here as well. Although the difference between the hosts got smoothed down.
I think that this representation of the speed of the hosts is clearer for most people. And to a certain extent it’s even more precise that the charts displaying the data from the multiple test locations. The matter is that the data from multiple test locations add not only deeper view on the hosting speed, but also add ambiguity.
Aggregating the data allows to get a clearer and less ambiguous view. But at the same time it loses some subtle details compared to the charts with test locations. Anyway, aggregated charts are more often used to analyze hosting performance.
Sometimes people use just one test location to judge the hosting speed. As you could see in the previous chapter, this approach can give you lots of false positives (i.e. wrong assumptions that a hosting has issues with speed). It’s better to analyze data from multiple test locations as I do.
Okay, back to the chart displayed above.
Both hosts look quite similar (except a couple of the two peaks sticking out). Let’s dig into some details now.
As we can see, a more general chart like this makes A2 Hosting look sort of better than how A2 looks like at the charts with test locations. Still we see a couple of peaks which means that indeed A2 sometimes does have speed issues. The serious issues (the peaks) are very short-term.
Anyway, although the charts only display two peaks, we need to understand that there may be more peaks. This is so because the tests run with 20-minute intervals. There may be more peaks between the tests which were run. By the way, the uptime performance (see my table with monthly uptime reports summary) confirms that A2 Hosting has less reliable performance than SiteGround.
Of course, A2 hosting still stays one of the best performing hosts out there. Besides, many users don’t pay much attention to short-term downtimes (or slowdowns) if they take just a very little part of all the time. By the way, what to be considered a good uptime I shared my thoughts in this article. A2 Hosting (not to mention SiteGround) looks very solid on a long run from uptime performance point of view.
SiteGround vs A2 Hosting speed in July, aggregated location
The speed of the hosts in July:
The specific pattern that repeats not only in this month is the following. A2 looks a little bit faster than SiteGround during a big large of the time. But A2 does not have as stable speed as SiteGround. SG has “spiky” pattern of the speed during almost the whole chart. Whereas A2 gets spiky less often, but the spikes occasionally get higher than the SG’s spikes.
SiteGround vs A2 Hosting speed in August, aggregated location
The speed of the hosts in August:
You can clearly see the peak of A2 Hosting speed on August, 15. Apart from that the patters of the hosts’ speed is like the previous month. I.e. SiteGround performs with more little speed spikes, whereas A2 Hosting’s base speed fluctuates more than SiteGround’s.
SiteGround vs A2 Hosting speed in September, aggregated location
The speed of the hosts in September:
From Septmeber 16 to September 24 there were some instability at A2 Hosting. It was not something serious, except one day of issues when the speed was peaking out (the 23d of Sep). The “fence” of frequent spikes did not get higher than 2.5 seconds. It’s slower than usually 1 second. It was not very slow. Anyway, the issue was noticeable compared to a normal A2 speed.
Before the 18th of September A2 and SiteGround had similar speed patterns as in previous months. I.e. SiteGround’s speed was more stable, whereas A2 Hosting was faster with occasional continues spikes (topping less than 2 seconds anyway, which is not a problem actually).
SiteGround vs A2 Hosting speed in October, aggregated location
The speed of the hosts in October:
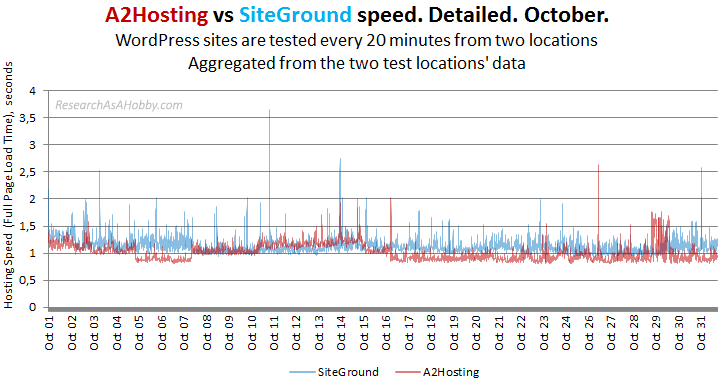
In this month A2 Hosting speed was a bit better that SiteGround from almost all perspectives. Apart from some minor issues on the 29th of October, A2 Hosting was faster and more stable than SiteGround. Although the difference was not significant, the performance can be considered as very similar.
SiteGround vs A2 Hosting speed in November, aggregated location
The speed of the hosts in November:
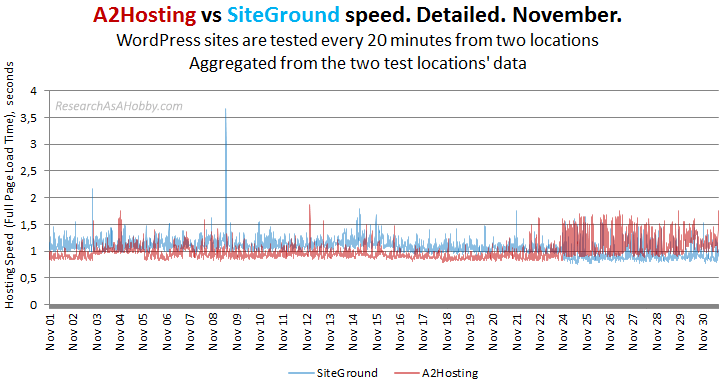
Again, we see the speed pattern like in the previous month. A2 Hosting is a bit faster and even more stable apart from some time. This month the A2’s instability lasted for about a week from the 24th of November to the end of the month. The instability was not critical, but compared to SiteGround the difference was noticeable.
SiteGround vs A2 Hosting speed in December, aggregated location
The speed of the hosts in December:
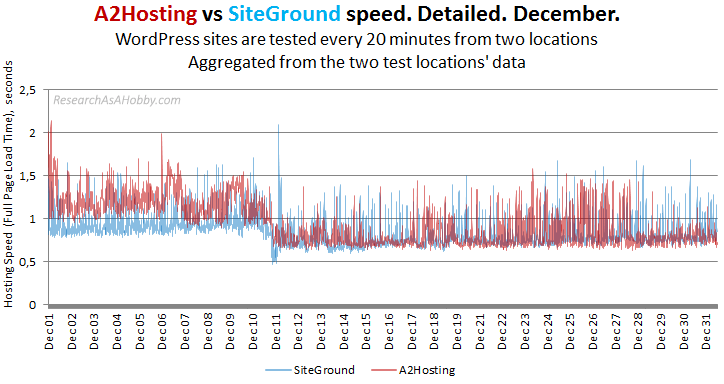
This month demonstrates similar speed behavior of the both hosts with the patterns you already know. I.e. A2 Hosting is a little bit faster (without spikes as SiteGround has during some time), but a bit more unstable than SiteGround at other time.
Another thing to notice is that both hosts sort of improved its speed on the 11th of December. I think it’s likely connected with the changing of speed measurement in the monitoring system. It’s very unlikely that both hosts changed its speed to the same extent at practically the same time. Anyway, the comparative speed of the hosts stays the same. And it’s fine for our analysis.
Histograms for A2 Hosting and SiteGround based on 20-min aggregated speed data
The charts with data ordered in a chronological order are naturally easy-to-understand. However, chronological data is very natural. I mean it good for analysis mostly using a common sense. In many ways it’s enough. But histograms can give you additional insights, especially when comparing the hosts.
If you don’t know what a histograms is, let me explain it in a few very simple words. Histogram is a chart which shows how many values get into specific intervals. In this case, a histogram for each host shows how many tests showed this or that speed.
Histograms are great because they allow accumulating and sorting all the initial data in a specific way. Hosting speed histograms can let you look at the core of the hosting speed performance.
General A2 Hosting speed histogram
Let’s have a look at A2 Hosting histogram with my notes:
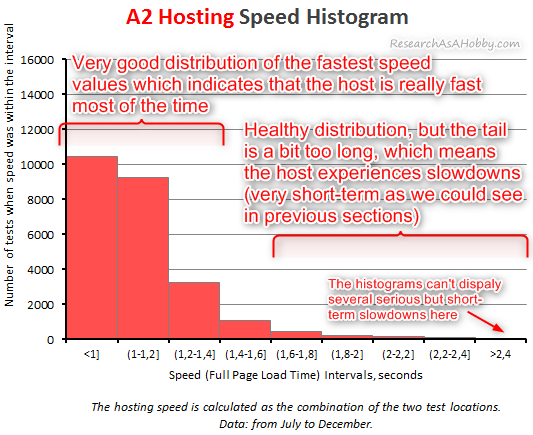
A2 Hosting was mostly very fast (see the first two columns on the histogram which outstand from the others). It looks really awesome. The only negative aspect is that there’s a quite long “tail” (columns indicating slower values). On the histogram it does not look any serious. But we know that the slowdowns (although short-term) do happen with A2 from time to time. Anyway, this is how a histogram of a really fast host may look like.
General SiteGround speed histogram
Let’s look at SiteGround’s histogram:
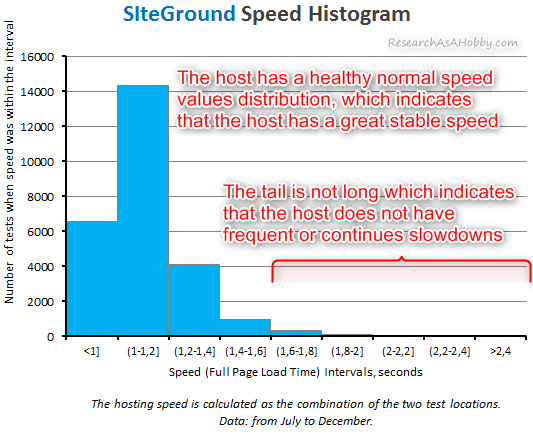
SiteGround’s speed histogram looks very healthy and quite classic for a very well-performing host. The biggest three columns on the chart indicate that most of the time the speed was very good. The “tail” of the right hand-side columns is not long and not high. It shows that the slowdowns are quite rare.
A2 Hosting detailed histogram
Now I’d like to show you the histograms which consist of smaller intervals. I called these detailed histograms “condensed” as you could see where the condensed distribution areas are. This kind of a histogram is great for visual analysis.
Let’s see at the A2 Hosting speed histogram with my notes:
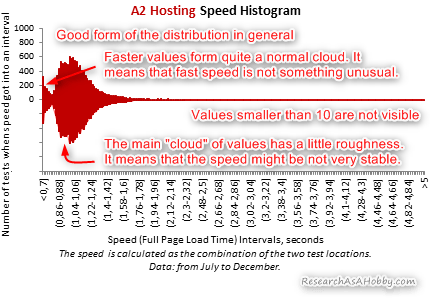
The histogram is not good at analyzing speed peak values, but it’s great to see the detailed form of distribution of the major set of values.
The main “cloud” of values is a large and has a great form. There is a little roughness which indicates that the speed during all period might be not very stable within its main speed interval. But in general it looks fine.
There is also a smaller “cloud” of speed values (faster than 0.8 seconds) looks superb. It shows that A2 has a strong concentration of speed values there.
It’s also worth mentioning that ideally a hosting should have just one “cloud” of speed values on its histogram. Existence of two separate clouds means that the hosting constantly has speed either from one cloud, or from the other. In case with A2 Hosting, it sounds like A2 is mostly fast, but sometimes very fast.
SiteGround detailed histogram
And this is how SiteGround’s speed on the detailed histogram looks like:
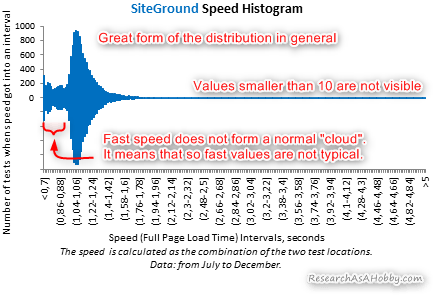
SiteGround, unlike A2 Hosting, has a sharper and vertically-stretched form of the main “cloud” on the histogram. It means that SiteGround has more stable speed. At the same time, the smaller (front) “cloud” does not really look like a cloud, but like a set of small clouds. To put it simply, SiteGround is usually as fast as 1-1.2 seconds, and if it goes faster, then it’s not typical to have a specific speed.
SiteGround vs A2 Hosting detailed histogram
Now let’s just see both histograms combined for easier comparison:
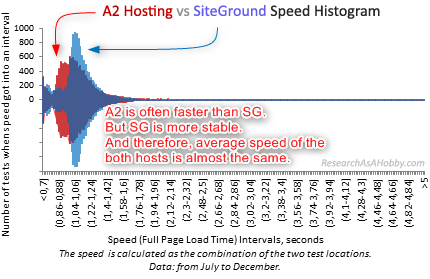
It’s interesting that although A2 Hosting looks like it’s faster, in fact the average speed is almost the same as SiteGround’s. This is so because SiteGround’s speed values are closely condensed around its average speed, whereas A2’s speed values are more spread. Also, of course, it matters that in general the speed of SiteGround is not only stable, but also very good. I.e. SG shows quite frequently a very fast performance (the part of the histogram to the left from the main “cloud”).
All SiteGround vs A2 Hosting speed charts in one place
This chapter simply contains all the charts used in this research for easy access. The charts do not contain my notes on them, just pure charts.
Click here to open the image with all the charts in one place.
Links to other resources to compare SiteGround and A2 Hosting speed
Here are other articles that can deepen and widen the speed comparison of SiteGround and A2 Hosting:
- SiteGround speed and server response time compared to other hosts including A2 Hosting
- Quality of SiteGround speed compared with other hosts (including A2) during the whole year. 788K Tests
- Summary tables of hosting performance including SiteGround and A2 by months
- Monthly reports on hosting performance (A2, SiteGround and 13 other hosts)
- Real-time speed monitoring of SiteGround and A2 (and other hosts) on the charts
Conclusion
This research is unique because it contains a big set (52,000+) of actual speed testing data (not Server Response Time tests, read here to know why it’s important). Unlike single speed tests, load tests or Time To First Byte (server response time) tests, it lets you look very close at the continuous speed changes of SiteGround and A2 during multiple months in a row.
Can you use this data from 2019 be used as a reference to the speed of SiteGround and A2 right now or in the future? Yes and no.
Of course, Yes. This research is based on the large set of real-life data of continuous hosting speed monitoring. This approach is the most reliable way to determine the real-life performance of a hosting. Apart from that, analyzing the data you can grasp the particularities a hosting speed with more details.
And NO. Speed of a host can change. Performance in this year does not guarantee the same performance the following year. But again, I run the hosting monitoring continuously. And you see my recent monthly reports to know the actual speed and you can even see the current hosting speed in real-life on the charts (the links are above).
And answering the question which hosting is better from speed point of view, well, both hosts are on-par actually. The slight but noticeable difference is that SiteGround’s performance is more stable (less peaks, better uptime) than A2. Monitoring the performance of the hosts goes on for years now and it brings more data to analyze.
The more real-life data, the better! 🙂
P.S.: Speed (and even uptime) is important, but not the only factors to consider when choosing a host. My reviews of SiteGround and A2Hosting can help you decide.
You can download a PDF version of this article (1 MB):


BTW, I respect your privacy, and of course I don't send spam, affiliate offers or trade your emails. What I send is information that I consider useful.