
This kind of research on A2 and SiteGround speed is not only unique, but also really helpful in the details. It gives you both the overview of the hosts’ speed in comparison during 6 months and individual hosting speed test results.
There were totally more than 52 K speed tests performed from January to June 2020 and analyzed in this article.
It’s the 2nd report of in which I compare the speed performance of SiteGround and A2 using tons of data and presenting the most detailed charts with real-time speed tests. You can find the first report here. It contains the methodology and all the introductory things you may want to know. In the current article I will focus on presenting the speed monitoring results and analysis for the outlined time period.
From this research you will know:
- Realistic overview of SiteGround’s and A2 Hosting’s speed can be (including short–time speed peaks and typical speed fluctuations of these hosts).
- The most detailed presentation of speed performance of SiteGround and A2 Hosting for 6 consecutive months (tests run continuously with 20-min intervals from two US locations).
- Analysis of these hosts’ performance.
Keep in mind that the data presented in this post are the real speed tests (Full Page Load Time). Sometimes people use Server Response Time or Time To First Byte tests which to estimate hosting speed, which is wrong.
If you choose a hosting between SiteGround and A2, I suggest reading my reviews of the hosts there: SiteGround review and A2 Hosting review).
How I tested SiteGround and A2 Hosting speed and analyzed the data
Why I made this research
I will put it briefly now. For more details please read this section of my initial article.
In addition to my monthly reports on hosting performance I decided to analyze in-depth the speed performance of the two well-known hosts – A2 and SiteGround. Running speed tests every 20 minutes from two locations gives me a lot of data that I put into detailed charts for you.
Having lots of data allows me to grasp nuances which stay under radar if you run a little number of tests. The conclusions from single speed tests can be very unreliable and can be greatly misleading.
Some bloggers evaluating hosting speed run a very limited number of tests . This is an unreliable approach. I want more solid data to draw my conclusions.
The methodology
More details on how Irun the tests and how I processed the results are in
this section of my other article. And now I will put it very briefly here:
- I anonymously bought cheapest hosting packages at A2Hosting and SiteGround. And installed WordPress with a dozen of articles with images on the front page.
- I’m using monitis.com service to monitor the speed (Full Page load Time). The tests run every 20 minutes from two locations. More details on how I monitor the websites’ performance is here.
- I put together the monitoring data into a spreadsheet to built the chart.
By the way, if you want to see the charts displaying original individual real-time and historic speed test values yourself, you can do it at the charts which are located below my reviews for SiteGround and for A2 Hosting).
Charts to analyze which host is faster
Now let’s compare and analyze the speed of A2 and SiteGround.
The most detailed 20-min hosting speed charts
In this chapter I put the charts with the raw speed monitoring data. The data includes all the registered peaks from both test locations. These are the most detailed hosting speed charts (for 6 months at once and for each of the months separately) for each host.
SIteGround and A2 Hosting from January to June from two testing locations
On the two combined charts below you can see all the speed data I got for this reserch. The limitations of the charts are obvious – there are too many data (52+K speed values in total) to display on the charts for detailed analysis. Single speed values are imposible to see. But it allows to reveal the speed peaks and overall performance.
So, here’s a bird-eye overview of the speed of A2 Hosting and SiteGround:
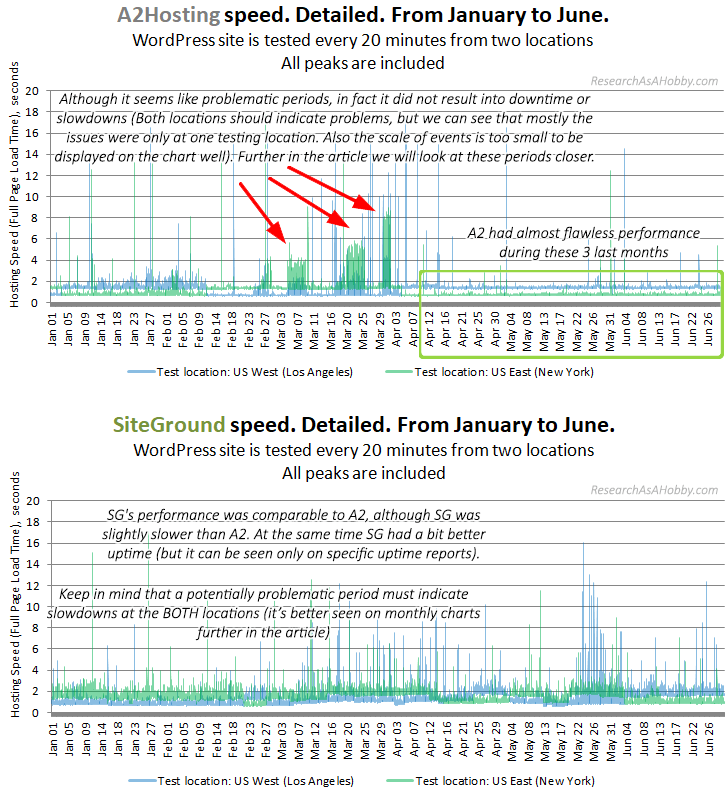
I’ve put a note on the chart above with the main insights that this chart comes up with:
- Although it seems like the hosts had problematic periods (particularly it regards A2), in fact “the colored columns” did not result into downtime or slowdowns. The reason behind it is that both locations should indicate problems, not just one of the locations. And since we can see that mostly the issues were only at one testing location, it was a testing location issue, not the hosting performance problem.
- Also, the scale of events is too small to be displayed on the chart well). Further in the article we will look at these periods closer.
- A2Hosting had almost flawless performance during the three last months.
- SiteGround’s performance was comparable to A2’s, although SiteGround was slightly slower than A2. At the same time SiteGround had a bit better uptime (you can see the monthly uptime of the hosts in the table here).
- Keep in mind that the potentially problematic period must indicate slowdowns at the BOTH locations at the same time (you can see it clearer on monthly charts further in the article).
In general, both hosts have stellar speed performance. The charts display a number of short-term peaks. But when taking into account the Satisfactory Apdex data (see this section), we can see that by and large the slowdowns took place too rarely in terms of statistics.
Also, the performance of the hosts is not permanent, although does not change significantly. Anyway, judging by the charts, A2Hosting looks better than SiteGround from April to June.
The hosting speed in January from two locations
Here’s the combined charts with speed of SiteGround and A2 Hosting in January:
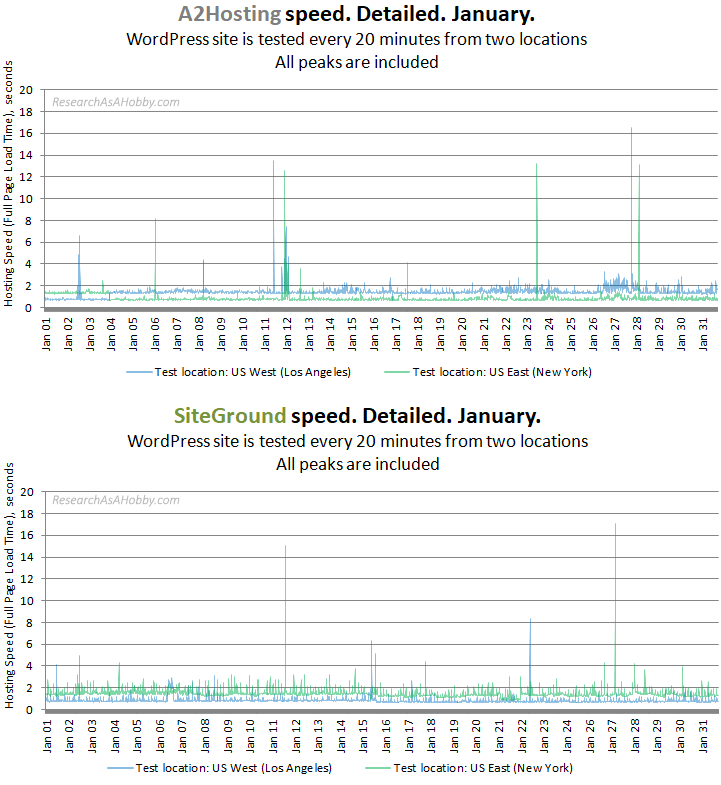
This month was pretty flawless for both hosts. A2 shows a little bit faster performance. But the difference is almost intangible.
The hosting speed in February from two locations
Here’s the chart to compare the 20-min speed checks of SiteGround and A2 Hosting in February:
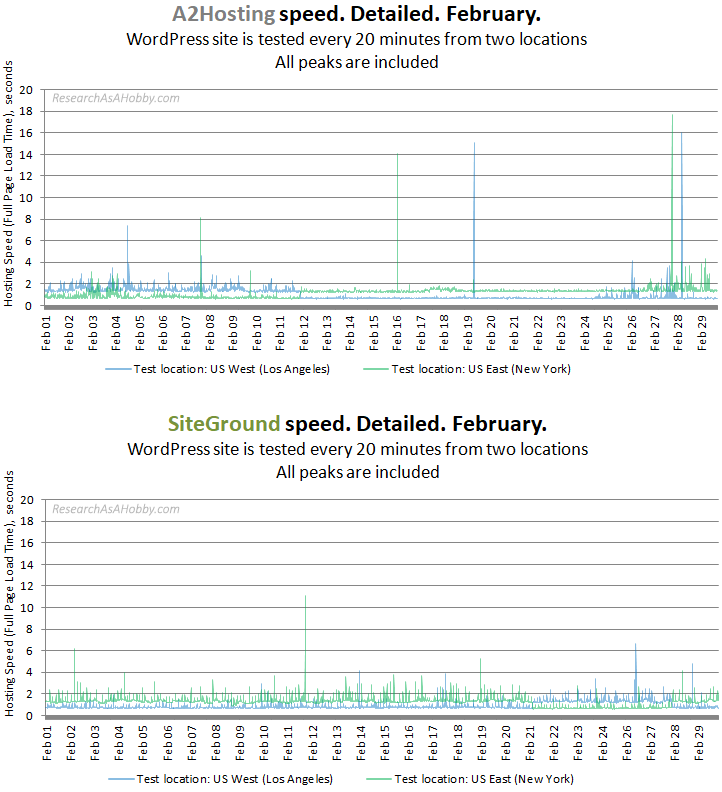
In February SiteGround was a bit more stable than A2. But this is an example of these analysis limitations – we can’t see downtimes on the charts unless there were speed issues too. In February A2 did not have speed issues, but its uptime was worse than SiteGround’s (see this report for more details).
The hosting speed in March from two locations
The charts with A2 Hosting and SiteGround speed:
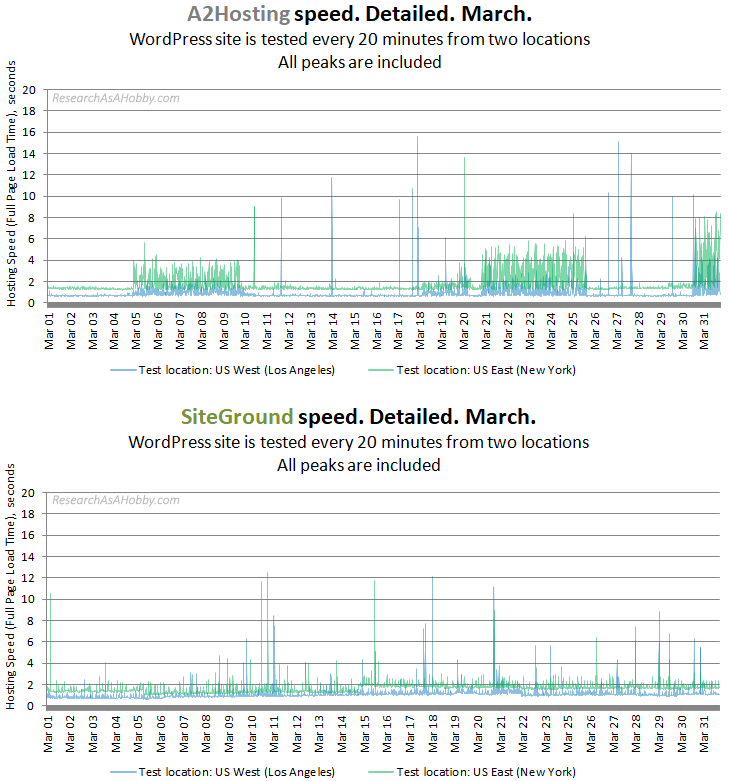
This is an interesting month to analyze. Although on the A2’s chart we can see sort of slight instability, it did not really affect the average speed of A2 Hosting (more details are in this report). This is where detailed speed charts add up to monthly averages values. There was some speed instability at A2 hosting detected during this month (see the spiky areas on the A2’s chart), but on average it was not significant.
The hosting speed in April from two locations
Here is the chart with the displayed speed of A2 Hosting and SiteGround in April:
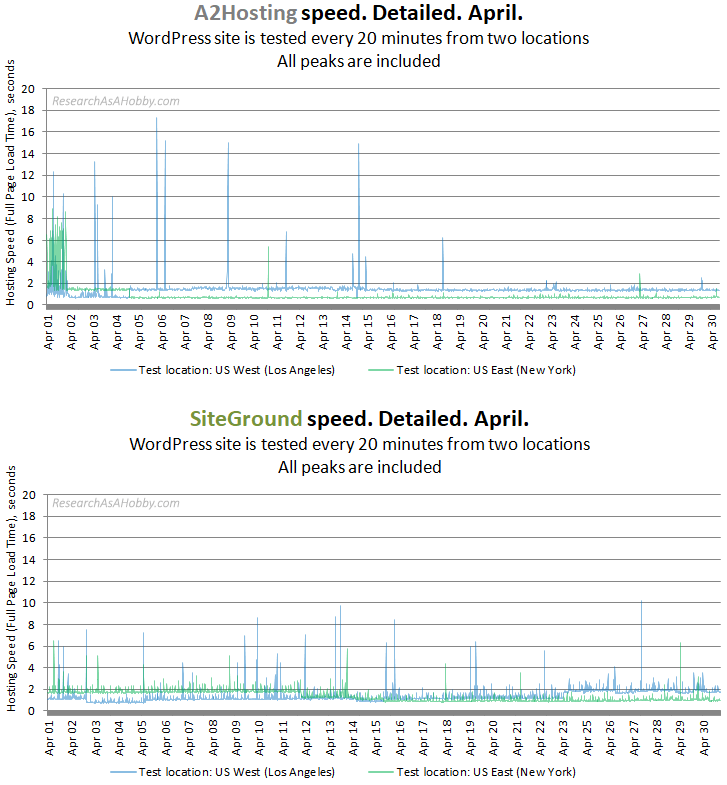
Both hosts look pretty fine. A2Hosting was a bit faster though. Slight speed instability in the beginning of the month did not result into average speed decreasing.
The hosting speed in May from two locations
Here is the chart with the displayed speed of A2 Hosting and SiteGround in May:
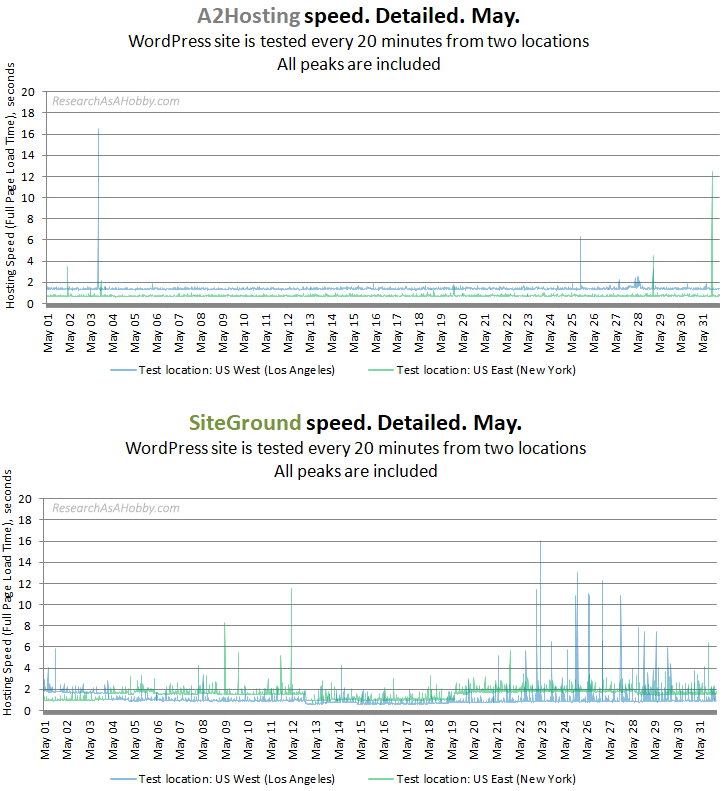
Performance of the both hosts was quite similar in this month. But A2Hosting was a bit faster.
The hosting speed in June from two locations
And here goes the chart with the speed of A2 Hosting and SiteGround in June:
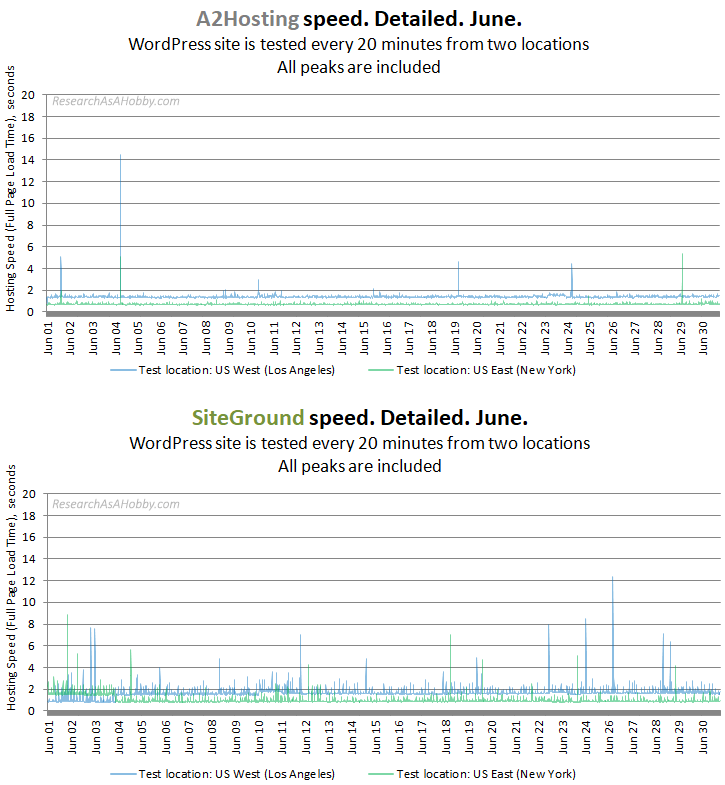
Speed of the both hosts was stellar this month. Not much to add.
A2 Hosting and SiteGround 20-min speed charts with aggregated locations’ values
You can compare speed of SiteGround and A2 Hosting using the charts above. It is the most precise way. But multiple test locations may confuse some people. That’s why in this chapter I also display the speed comparison in a classic way – two hosts on one chart.
In the methodology above I explained how I got the aggregated speed for each hosting using the data from multiple test locations. Although this is a bit simplified way of comparing the hosts, it still makes a lot of sense as it gives side-by-side hosting speed comparison.
SIteGround or A2 Hosting speed from January to June, aggregated location
Here’s the 20-min chart with A2 Hosting and SiteGround speed for 6 months.
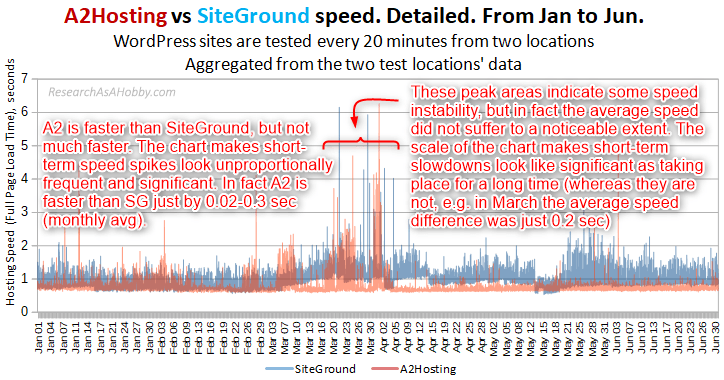
In general the notes on the chart above say it all. The chart allows seeing some speed instability, but it does not let us know how really small or big was the effect on the average speed. But combined with the monthly charts, as well as with the average speed data by months, it all becomes the useful source of information.
In general, A2 was a bit faster than SiteGround. At the same time, due to the chart displaying limitations, SiteGround’s speed looks worse on the charts than it really is.
In other words, both hosts have very good speed performance.
Hosting speed in January, aggregated location
The speed of the hosts in January:
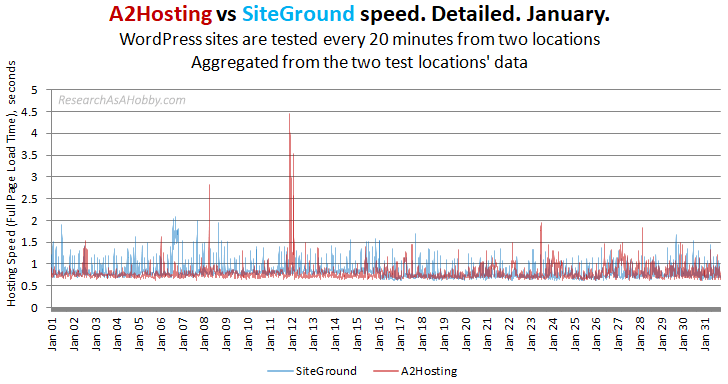
This month both hosts performed very well. Short little slowdown of A2 took place on the 12th of January or so. But it was not critical at all.
Hosting speed in February, aggregated location
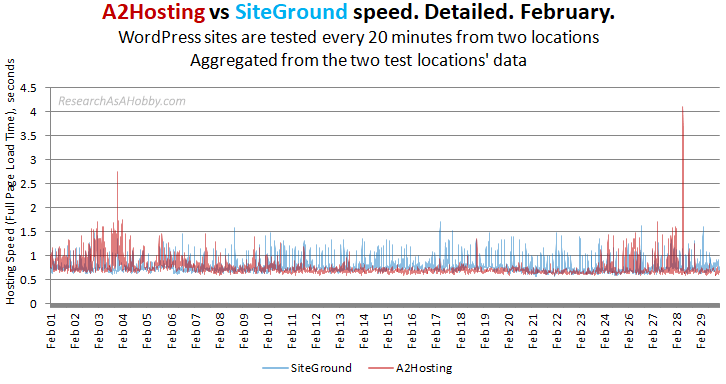
Both hosts had nearly equal average speed in February. There were no considerable and long-term slowdowns. It was a great speed performance of both A2 and SiteGround.
Hosting speed in March, aggregated location
The speed of the hosts in March:
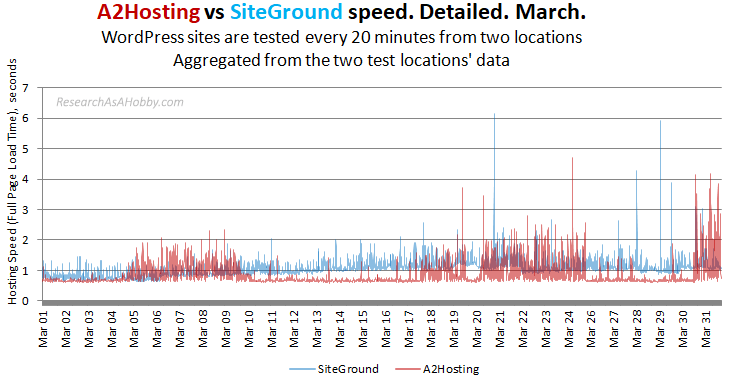
There were some minor speed instability of A2, but anyway A2 was not slower even during these periods. And in general you can see that A2Hosting was noticeably faster than SiteGround. At the same time SiteGround was really fast. The competition between two great hosts goes on 🙂
Hosting speed in April, aggregated location
The speed of the hosts in April:
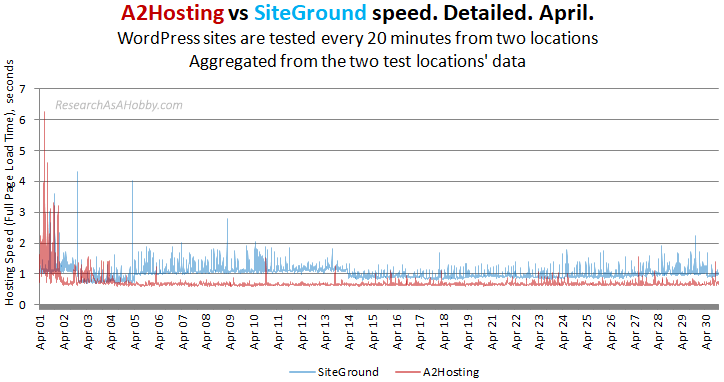
A2Hosting performed comparatively better than SiteGround in this month. The slight speed instability on the 1st of April did not affect the average speed values.
Hosting speed in May, aggregated location
The speed of the hosts in May:
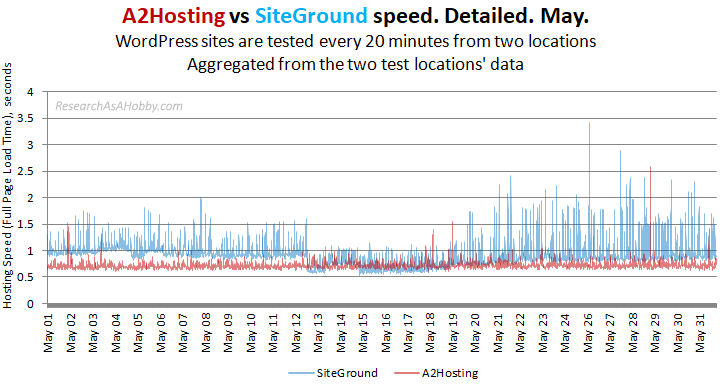
Again, A2Hosting was faster than SiteGround a little bit. At the same time don’t be misled by short term speed spikes of SiteGround, since they are too short-term and insignificant to affect the average hosting speed.
Hosting speed in June, aggregated location
The speed of the hosts in June:
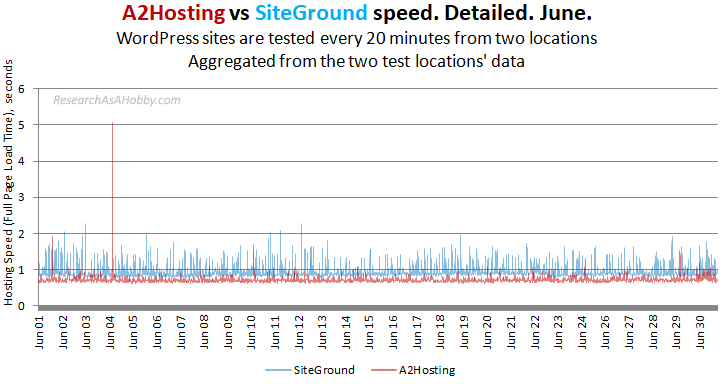
Well, both hosts are great. A2Hosting looks more attractive, but just slightly 🙂
Histograms for A2 Hosting and SiteGround based on 20-min aggregated speed data
The charts with data ordered in a chronological order are naturally easy-to-understand. However, chronological data is very natural. I mean it good for analysis mostly using a common sense. In many ways it’s enough. But histograms can give you additional insights, especially when comparing the hosts.
If you don’t know what a histograms is, let me explain it in a few very simple words. Histogram is a chart which shows how many values get into specific intervals. In this case, a histogram for each host shows how many tests showed this or that speed.
Histograms are great because they allow accumulating and sorting all the initial data in a specific way. Hosting speed histograms can let you look at the core of the hosting speed performance.
A2 Hosting speed general histogram
Let’s have a look at A2 Hosting speed histogram with my notes:
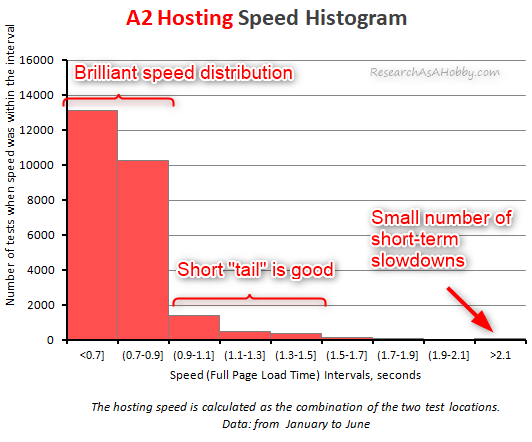
A2 Hosting was amazingly fast (see the first two columns on the histogram which greatly outstand from the others). It looks really awesome. The “tail” (columns indicating slower values) is short with a small number of slow values (the last column).
SiteGround speed general histogram
Let’s look at SiteGround speed histogram:
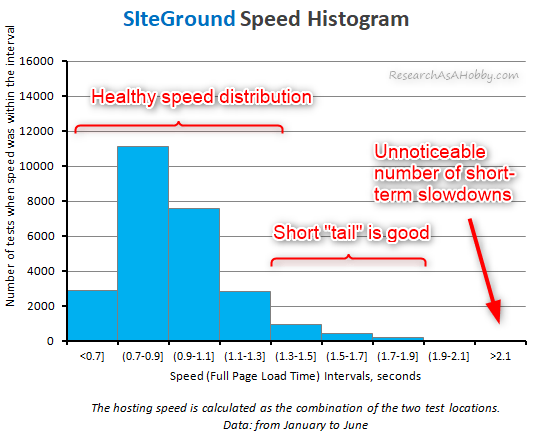
SiteGround’s speed histogram looks very healthy and quite classic for a very well-performing host. A2 was faster, but at the same time SiteGround has less slow-speed values (SiteGround does not have visible last column at all).
A2 Hosting detailed histogram
Now I’d like to show you the histograms which consist of smaller intervals. I called these detailed histograms “condensed” as you could see where the condensed distribution areas are. This kind of a histogram is great for visual analysis.
Let’s see at the A2 Hosting speed histogram with my notes:
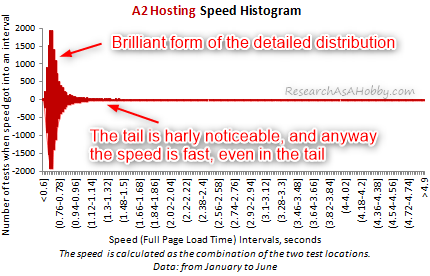
The histogram of A2Hosting’s speed is just a pleasure to look at 🙂
The main “cloud” of values is tall and pretty short, i.e. it has a great form. No roughness on the slopes (it means stable speed performance in general). A bit extended tail on the right hand side indicates that the host slowdowns from time to time, but quite rarely and far-far from extremes. Superb!
SiteGround detailed histogram
And this is how SiteGround’s speed on the detailed histogram looks like:
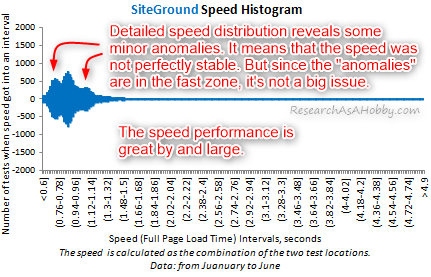
SiteGround, unlike A2 Hosting, has a bit deformed “cloud” of speed values. It still holds its form in general. But the the minor “anomalies” (hills on the chart) indicate that the hosting speed changed from one stable level to another. Anyway, all the speed values are concentrated in a fast zone. And this is the most important for users – they get fast hosting.
SiteGround vs A2 Hosting detailed histogram
Now let’s just see both histograms combined for easier comparison:
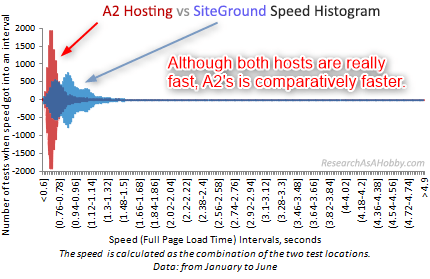
When comparing two hosts on the same speed histogram, A2 looks more appealing, no doubt. But do not forget that SiteGround is very fast. We just are comparing two great hosts. And A2Hosting has been a bit faster.
All SiteGround vs A2 Hosting speed charts in one place
This chapter simply contains all the charts used in this research for easy access. The charts do not contain my notes on them, just pure charts.
Click here to open the image with all the charts.
Links to other resources to compare SiteGround and A2 Hosting speed
Here are other articles that can deepen and widen the speed comparison of SiteGround and A2 Hosting:
- Previous report on A2 vs Siteground speed performance research (previous 6 months analyzed)
- Summary tables of hosting performance including SiteGround and A2 by months
- Monthly reports on hosting performance (A2, SiteGround and 13 other hosts)
- Real-time speed monitoring of SiteGround and A2 (and other hosts) on the charts
Conclusion
This research is unique because it contains a big set (52,000+) of actual speed testing data (not Server Response Time tests, read here to know why it’s important). Unlike single speed tests, load tests or Time To First Byte (server response time) tests, it lets you look very close at the continuous speed changes of SiteGround and A2 during multiple months in a row.
Answering the question which hosting is better from speed point of view, well, both hosts are on-par actually. The slight but noticeable difference is that A2’s performance has been a bit faster than SiteGround. Monitoring the performance of the hosts goes on for years now and it will brings even more data to analyze in future.
The more real-life data, the better! 🙂
P.S.: Speed (and even uptime) is important, but not the only factors to consider when choosing a host. My reviews of SiteGround and A2Hosting can help you decide.

BTW, I respect your privacy, and of course I don't send spam, affiliate offers or trade your emails. What I send is information that I consider useful.


Thank you for the useful information. I follow you closely.
You are welcome. Feel free to let me know if you have any questions.
I love siteground, they have this ability to give you a fast loading speed, i dont know how they did that but they are great on that. Thanks for sharing this with us. Love your site.
SiteGround has been a cool and fast hosting, although quite expensive on renewals. We will see if the host can hold its clients’ love for a long time 🙂 When people get a high-level service, their expectations raise. And a host must keep up with the quality in order to keep the love.
Firstly, thank you so much for this detailed information on
this topic, I really love to read your article and i will
love to read your next article very soon.
You are welcome, Bibek. Feel free to ask any questions.